Immigrants from Mexico vs New Zealander Child Poverty Among Girls Under 16

COMPARE

Immigrants from Mexico
Race
Ancestry
AfghanAfricanAlaska NativeAlaskan AthabascanAlbanianAleutAlsatianAmericanApacheArabArapahoArgentineanArmenianAssyrian/Chaldean/SyriacAustralianAustrianBahamianBangladeshiBarbadianBasqueBelgianBelizeanBermudanBhutaneseBlackfeetBolivianBrazilianBritishBritish West IndianBulgarianBurmeseCajunCambodianCanadianCape VerdeanCarpatho RusynCelticCentral AmericanCentral American IndianCherokeeCheyenneChickasawChileanChineseChippewaChoctawColombianColvilleComancheCosta RicanCreeCreekCroatianCrowCubanCypriotCzechCzechoslovakianDanishDelawareDominicanDutchDutch West IndianEastern EuropeanEcuadorianEgyptianEnglishEstonianEthiopianEuropeanFijianFilipinoFinnishFrenchFrench American IndianFrench CanadianGermanGerman RussianGhanaianGreekGuamanian/ChamorroGuatemalanGuyaneseHaitianHmongHonduranHopiHoumaHungarianIcelanderIndian (Asian)IndonesianInupiatIranianIraqiIrishIroquoisIsraeliItalianJamaicanJapaneseJordanianKenyanKiowaKoreanLaotianLatvianLebaneseLiberianLithuanianLumbeeLuxembourgerMacedonianMalaysianMalteseMarshalleseMenomineeMexicanMexican American IndianMongolianMoroccanNative HawaiianNavajoNepaleseNicaraguanNigerianNorthern EuropeanNorwegianOkinawanOsageOttawaPaiutePakistaniPalestinianPanamanianParaguayanPennsylvania GermanPeruvianPimaPolishPortuguesePotawatomiPuebloPuerto RicanPuget Sound SalishRomanianRussianSalvadoranSamoanScandinavianScotch-IrishScottishSeminoleSenegaleseSerbianShoshoneSierra LeoneanSiouxSlavicSlovakSloveneSomaliSouth AfricanSouth AmericanSouth American IndianSoviet UnionSpaniardSpanishSpanish AmericanSpanish American IndianSri LankanSubsaharan AfricanSudaneseSwedishSwissSyrianTaiwaneseThaiTlingit-HaidaTohono O'OdhamTonganTrinidadian and TobagonianTsimshianTurkishU.S. Virgin IslanderUgandanUkrainianUruguayanUteVenezuelanVietnameseWelshWest IndianYakamaYaquiYugoslavianYumanYup'ikZimbabwean
Immigration
NonimmigrantsImmigrantsAfghanistanAfricaAlbaniaArgentinaArmeniaAsiaAustraliaAustriaBahamasBangladeshBarbadosBelarusBelgiumBelizeBoliviaBosnia and HerzegovinaBrazilBulgariaBurma/MyanmarCabo VerdeCambodiaCameroonCanadaCaribbeanCentral AmericaChileChinaColombiaCongoCosta RicaCroatiaCubaCzechoslovakiaDenmarkDominicaDominican RepublicEastern AfricaEastern AsiaEastern EuropeEcuadorEgyptEl SalvadorEnglandEritreaEthiopiaEuropeFijiFranceGermanyGhanaGreeceGrenadaGuatemalaGuyanaHaitiHondurasHong KongHungaryIndiaIndonesiaIranIraqIrelandIsraelItalyJamaicaJapanJordanKazakhstanKenyaKoreaKuwaitLaosLatin AmericaLatviaLebanonLiberiaLithuaniaMalaysiaMexicoMicronesiaMiddle AfricaMoldovaMoroccoNepalNetherlandsNicaraguaNigeriaNorth AmericaNorth MacedoniaNorthern AfricaNorthern EuropeNorwayOceaniaPakistanPanamaPeruPhilippinesPolandPortugalRomaniaRussiaSaudi ArabiaScotlandSenegalSerbiaSierra LeoneSingaporeSomaliaSouth AfricaSouth AmericaSouth Central AsiaSouth Eastern AsiaSouthern EuropeSpainSri LankaSt. Vincent and the GrenadinesSudanSwedenSwitzerlandSyriaTaiwanThailandTrinidad and TobagoTurkeyUgandaUkraineUruguayUzbekistanVenezuelaVietnamWest IndiesWestern AfricaWestern AsiaWestern EuropeYemenZaireZimbabweAzores
New Zealander
Race
Ancestry
AfghanAfricanAlaska NativeAlaskan AthabascanAlbanianAleutAlsatianAmericanApacheArabArapahoArgentineanArmenianAssyrian/Chaldean/SyriacAustralianAustrianBahamianBangladeshiBarbadianBasqueBelgianBelizeanBermudanBhutaneseBlackfeetBolivianBrazilianBritishBritish West IndianBulgarianBurmeseCajunCambodianCanadianCape VerdeanCarpatho RusynCelticCentral AmericanCentral American IndianCherokeeCheyenneChickasawChileanChineseChippewaChoctawColombianColvilleComancheCosta RicanCreeCreekCroatianCrowCubanCypriotCzechCzechoslovakianDanishDelawareDominicanDutchDutch West IndianEastern EuropeanEcuadorianEgyptianEnglishEstonianEthiopianEuropeanFijianFilipinoFinnishFrenchFrench American IndianFrench CanadianGermanGerman RussianGhanaianGreekGuamanian/ChamorroGuatemalanGuyaneseHaitianHmongHonduranHopiHoumaHungarianIcelanderIndian (Asian)IndonesianInupiatIranianIraqiIrishIroquoisIsraeliItalianJamaicanJapaneseJordanianKenyanKiowaKoreanLaotianLatvianLebaneseLiberianLithuanianLumbeeLuxembourgerMacedonianMalaysianMalteseMarshalleseMenomineeMexicanMexican American IndianMongolianMoroccanNative HawaiianNavajoNepaleseNew ZealanderNicaraguanNigerianNorthern EuropeanNorwegianOkinawanOsageOttawaPaiutePakistaniPalestinianPanamanianParaguayanPennsylvania GermanPeruvianPimaPolishPortuguesePotawatomiPuebloPuerto RicanPuget Sound SalishRomanianRussianSalvadoranSamoanScandinavianScotch-IrishScottishSeminoleSenegaleseSerbianShoshoneSierra LeoneanSiouxSlavicSlovakSloveneSomaliSouth AfricanSouth AmericanSouth American IndianSoviet UnionSpaniardSpanishSpanish AmericanSpanish American IndianSri LankanSubsaharan AfricanSudaneseSwedishSwissSyrianTaiwaneseThaiTlingit-HaidaTohono O'OdhamTonganTrinidadian and TobagonianTsimshianTurkishU.S. Virgin IslanderUgandanUkrainianUruguayanUteVenezuelanVietnameseWelshWest IndianYakamaYaquiYugoslavianYumanYup'ikZimbabwean
Immigration
NonimmigrantsImmigrantsAfghanistanAfricaAlbaniaArgentinaArmeniaAsiaAustraliaAustriaBahamasBangladeshBarbadosBelarusBelgiumBelizeBoliviaBosnia and HerzegovinaBrazilBulgariaBurma/MyanmarCabo VerdeCambodiaCameroonCanadaCaribbeanCentral AmericaChileChinaColombiaCongoCosta RicaCroatiaCubaCzechoslovakiaDenmarkDominicaDominican RepublicEastern AfricaEastern AsiaEastern EuropeEcuadorEgyptEl SalvadorEnglandEritreaEthiopiaEuropeFijiFranceGermanyGhanaGreeceGrenadaGuatemalaGuyanaHaitiHondurasHong KongHungaryIndiaIndonesiaIranIraqIrelandIsraelItalyJamaicaJapanJordanKazakhstanKenyaKoreaKuwaitLaosLatin AmericaLatviaLebanonLiberiaLithuaniaMalaysiaMicronesiaMiddle AfricaMoldovaMoroccoNepalNetherlandsNicaraguaNigeriaNorth AmericaNorth MacedoniaNorthern AfricaNorthern EuropeNorwayOceaniaPakistanPanamaPeruPhilippinesPolandPortugalRomaniaRussiaSaudi ArabiaScotlandSenegalSerbiaSierra LeoneSingaporeSomaliaSouth AfricaSouth AmericaSouth Central AsiaSouth Eastern AsiaSouthern EuropeSpainSri LankaSt. Vincent and the GrenadinesSudanSwedenSwitzerlandSyriaTaiwanThailandTrinidad and TobagoTurkeyUgandaUkraineUruguayUzbekistanVenezuelaVietnamWest IndiesWestern AfricaWestern AsiaWestern EuropeYemenZaireZimbabweAzores
Child Poverty Among Girls Under 16
Income
Poverty
Unemployment
Labor Participation
Family Structure
Vehicle Availability
Education Level
Disability

Child Poverty Among Girls Under 16 Comparison

Immigrants from Mexico

New Zealanders

Tragic
Excellent
21.6%
CHILD POVERTY AMONG GIRLS UNDER 16
0.0/ 100
METRIC RATING
312th/ 347
METRIC RANK
15.6%
CHILD POVERTY AMONG GIRLS UNDER 16
87.2/ 100
METRIC RATING
140th/ 347
METRIC RANK

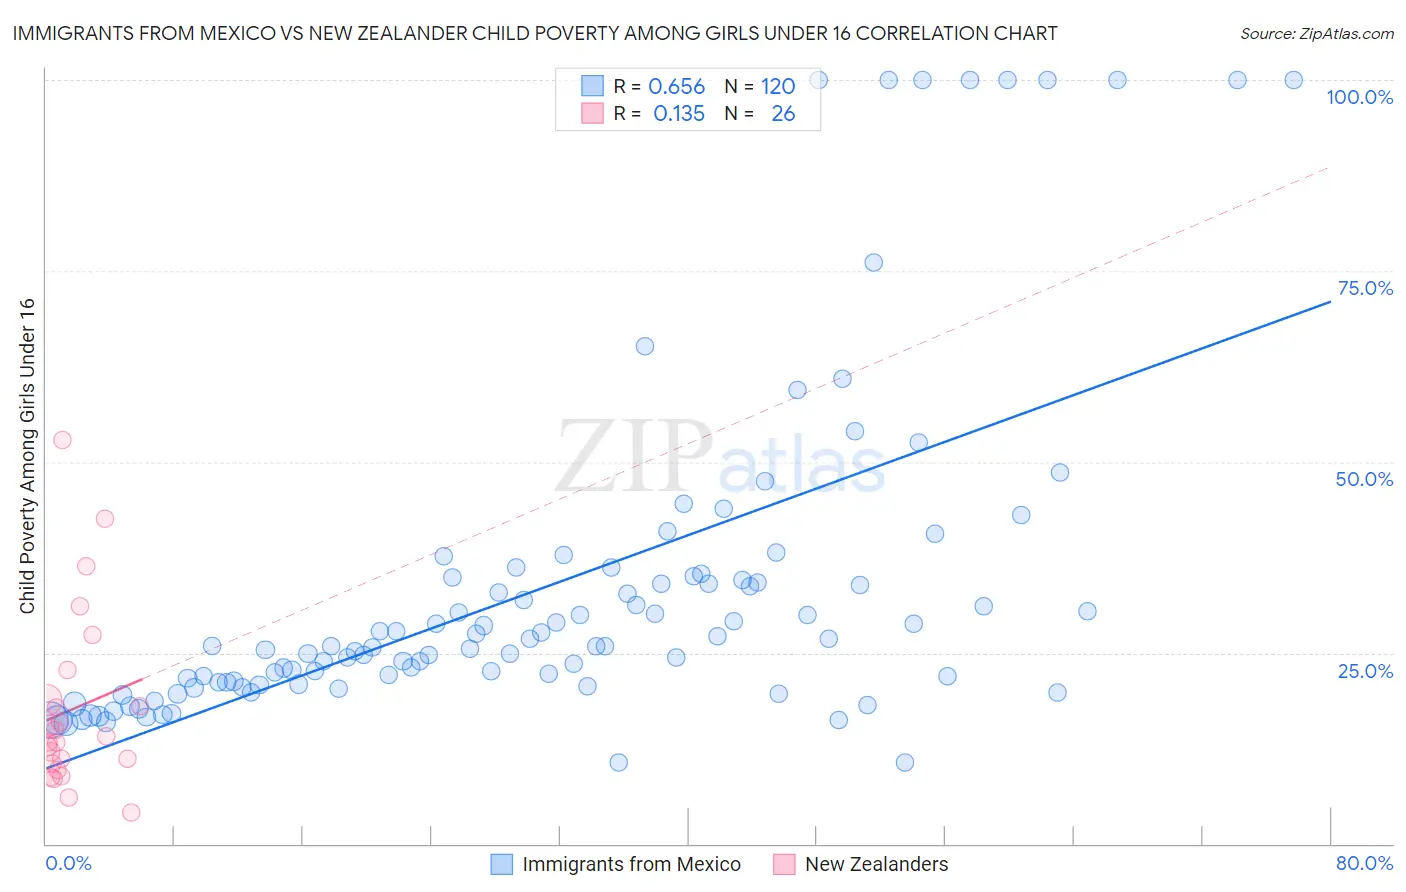
Immigrants from Mexico vs New Zealander Child Poverty Among Girls Under 16 Correlation Chart

The statistical analysis conducted on geographies consisting of 501,744,550 people shows a significant positive correlation between the proportion of Immigrants from Mexico and poverty level among girls under the age of 16 in the United States with a correlation coefficient (R) of 0.656 and weighted average of 21.6%. Similarly, the statistical analysis conducted on geographies consisting of 106,265,230 people shows a poor positive correlation between the proportion of New Zealanders and poverty level among girls under the age of 16 in the United States with a correlation coefficient (R) of 0.135 and weighted average of 15.6%, a difference of 39.0%.
Immigrants from Mexico vs New Zealander Child Poverty Among Girls Under 16

Child Poverty Among Girls Under 16 Correlation Summary

MeasurementImmigrants from MexicoNew Zealander
Minimum10.6%4.2%
Maximum100.0%52.9%
Range89.4%48.7%
Mean33.4%17.6%
Median25.9%13.7%
Interquartile 25% (IQ1)21.0%10.4%
Interquartile 75% (IQ3)34.7%18.8%
Interquartile Range (IQR)13.8%8.4%
Standard Deviation (Sample)21.9%11.6%
Standard Deviation (Population)21.8%11.4%

Similar Demographics by Child Poverty Among Girls Under 16

Demographics Similar to Immigrants from Mexico by Child Poverty Among Girls Under 16

In terms of child poverty among girls under 16, the demographic groups most similar to Immigrants from Mexico are Dutch West Indian (21.6%, a difference of 0.23%), Immigrants from Somalia (21.6%, a difference of 0.29%), Creek (21.7%, a difference of 0.50%), Arapaho (21.7%, a difference of 0.51%), and Bahamian (21.5%, a difference of 0.56%).
DemographicsRating | RankChild Poverty Among Girls Under 16
Guatemalans
0.0
/100
|
#305
Tragic
21.4%
Immigrants | Central America
0.0
/100
|
#306
Tragic
21.4%
Immigrants | Bahamas
0.0
/100
|
#307
Tragic
21.4%
Houma
0.0
/100
|
#308
Tragic
21.5%
Bahamians
0.0
/100
|
#309
Tragic
21.5%
Immigrants | Somalia
0.0
/100
|
#310
Tragic
21.6%
Dutch West Indians
0.0
/100
|
#311
Tragic
21.6%
Immigrants | Mexico
0.0
/100
|
#312
Tragic
21.6%
Creek
0.0
/100
|
#313
Tragic
21.7%
Arapaho
0.0
/100
|
#314
Tragic
21.7%
Ute
0.0
/100
|
#315
Tragic
21.8%
Immigrants | Guatemala
0.0
/100
|
#316
Tragic
21.9%
Africans
0.0
/100
|
#317
Tragic
21.9%
Immigrants | Dominica
0.0
/100
|
#318
Tragic
22.1%
U.S. Virgin Islanders
0.0
/100
|
#319
Tragic
22.1%

Demographics Similar to New Zealanders by Child Poverty Among Girls Under 16

In terms of child poverty among girls under 16, the demographic groups most similar to New Zealanders are Immigrants from Jordan (15.6%, a difference of 0.010%), Canadian (15.6%, a difference of 0.030%), Armenian (15.5%, a difference of 0.18%), Immigrants from Peru (15.6%, a difference of 0.18%), and Israeli (15.6%, a difference of 0.26%).
DemographicsRating | RankChild Poverty Among Girls Under 16
Brazilians
89.6
/100
|
#133
Excellent
15.4%
Immigrants | Spain
89.1
/100
|
#134
Excellent
15.5%
Czechoslovakians
89.0
/100
|
#135
Excellent
15.5%
Native Hawaiians
89.0
/100
|
#136
Excellent
15.5%
South Africans
88.7
/100
|
#137
Excellent
15.5%
Immigrants | Vietnam
88.2
/100
|
#138
Excellent
15.5%
Armenians
87.9
/100
|
#139
Excellent
15.5%
New Zealanders
87.2
/100
|
#140
Excellent
15.6%
Immigrants | Jordan
87.2
/100
|
#141
Excellent
15.6%
Canadians
87.1
/100
|
#142
Excellent
15.6%
Immigrants | Peru
86.6
/100
|
#143
Excellent
15.6%
Israelis
86.3
/100
|
#144
Excellent
15.6%
Welsh
85.4
/100
|
#145
Excellent
15.6%
Samoans
84.2
/100
|
#146
Excellent
15.7%
Slavs
83.1
/100
|
#147
Excellent
15.7%