Immigrants from Malaysia vs Immigrants from Uruguay Poverty

COMPARE

Immigrants from Malaysia
Race
Ancestry
AfghanAfricanAlaska NativeAlaskan AthabascanAlbanianAleutAlsatianAmericanApacheArabArapahoArgentineanArmenianAssyrian/Chaldean/SyriacAustralianAustrianBahamianBangladeshiBarbadianBasqueBelgianBelizeanBermudanBhutaneseBlackfeetBolivianBrazilianBritishBritish West IndianBulgarianBurmeseCajunCambodianCanadianCape VerdeanCarpatho RusynCelticCentral AmericanCentral American IndianCherokeeCheyenneChickasawChileanChineseChippewaChoctawColombianColvilleComancheCosta RicanCreeCreekCroatianCrowCubanCypriotCzechCzechoslovakianDanishDelawareDominicanDutchDutch West IndianEastern EuropeanEcuadorianEgyptianEnglishEstonianEthiopianEuropeanFijianFilipinoFinnishFrenchFrench American IndianFrench CanadianGermanGerman RussianGhanaianGreekGuamanian/ChamorroGuatemalanGuyaneseHaitianHmongHonduranHopiHoumaHungarianIcelanderIndian (Asian)IndonesianInupiatIranianIraqiIrishIroquoisIsraeliItalianJamaicanJapaneseJordanianKenyanKiowaKoreanLaotianLatvianLebaneseLiberianLithuanianLumbeeLuxembourgerMacedonianMalaysianMalteseMarshalleseMenomineeMexicanMexican American IndianMongolianMoroccanNative HawaiianNavajoNepaleseNew ZealanderNicaraguanNigerianNorthern EuropeanNorwegianOkinawanOsageOttawaPaiutePakistaniPalestinianPanamanianParaguayanPennsylvania GermanPeruvianPimaPolishPortuguesePotawatomiPuebloPuerto RicanPuget Sound SalishRomanianRussianSalvadoranSamoanScandinavianScotch-IrishScottishSeminoleSenegaleseSerbianShoshoneSierra LeoneanSiouxSlavicSlovakSloveneSomaliSouth AfricanSouth AmericanSouth American IndianSoviet UnionSpaniardSpanishSpanish AmericanSpanish American IndianSri LankanSubsaharan AfricanSudaneseSwedishSwissSyrianTaiwaneseThaiTlingit-HaidaTohono O'OdhamTonganTrinidadian and TobagonianTsimshianTurkishU.S. Virgin IslanderUgandanUkrainianUruguayanUteVenezuelanVietnameseWelshWest IndianYakamaYaquiYugoslavianYumanYup'ikZimbabwean
Immigration
NonimmigrantsImmigrantsAfghanistanAfricaAlbaniaArgentinaArmeniaAsiaAustraliaAustriaBahamasBangladeshBarbadosBelarusBelgiumBelizeBoliviaBosnia and HerzegovinaBrazilBulgariaBurma/MyanmarCabo VerdeCambodiaCameroonCanadaCaribbeanCentral AmericaChileChinaColombiaCongoCosta RicaCroatiaCubaCzechoslovakiaDenmarkDominicaDominican RepublicEastern AfricaEastern AsiaEastern EuropeEcuadorEgyptEl SalvadorEnglandEritreaEthiopiaEuropeFijiFranceGermanyGhanaGreeceGrenadaGuatemalaGuyanaHaitiHondurasHong KongHungaryIndiaIndonesiaIranIraqIrelandIsraelItalyJamaicaJapanJordanKazakhstanKenyaKoreaKuwaitLaosLatin AmericaLatviaLebanonLiberiaLithuaniaMalaysiaMexicoMicronesiaMiddle AfricaMoldovaMoroccoNepalNetherlandsNicaraguaNigeriaNorth AmericaNorth MacedoniaNorthern AfricaNorthern EuropeNorwayOceaniaPakistanPanamaPeruPhilippinesPolandPortugalRomaniaRussiaSaudi ArabiaScotlandSenegalSerbiaSierra LeoneSingaporeSomaliaSouth AfricaSouth AmericaSouth Central AsiaSouth Eastern AsiaSouthern EuropeSpainSri LankaSt. Vincent and the GrenadinesSudanSwedenSwitzerlandSyriaTaiwanThailandTrinidad and TobagoTurkeyUgandaUkraineUzbekistanVenezuelaVietnamWest IndiesWestern AfricaWestern AsiaWestern EuropeYemenZaireZimbabweAzores
Immigrants from Uruguay
Race
Ancestry
AfghanAfricanAlaska NativeAlaskan AthabascanAlbanianAleutAlsatianAmericanApacheArabArapahoArgentineanArmenianAssyrian/Chaldean/SyriacAustralianAustrianBahamianBangladeshiBarbadianBasqueBelgianBelizeanBermudanBhutaneseBlackfeetBolivianBrazilianBritishBritish West IndianBulgarianBurmeseCajunCambodianCanadianCape VerdeanCarpatho RusynCelticCentral AmericanCentral American IndianCherokeeCheyenneChickasawChileanChineseChippewaChoctawColombianColvilleComancheCosta RicanCreeCreekCroatianCrowCubanCypriotCzechCzechoslovakianDanishDelawareDominicanDutchDutch West IndianEastern EuropeanEcuadorianEgyptianEnglishEstonianEthiopianEuropeanFijianFilipinoFinnishFrenchFrench American IndianFrench CanadianGermanGerman RussianGhanaianGreekGuamanian/ChamorroGuatemalanGuyaneseHaitianHmongHonduranHopiHoumaHungarianIcelanderIndian (Asian)IndonesianInupiatIranianIraqiIrishIroquoisIsraeliItalianJamaicanJapaneseJordanianKenyanKiowaKoreanLaotianLatvianLebaneseLiberianLithuanianLumbeeLuxembourgerMacedonianMalaysianMalteseMarshalleseMenomineeMexicanMexican American IndianMongolianMoroccanNative HawaiianNavajoNepaleseNew ZealanderNicaraguanNigerianNorthern EuropeanNorwegianOkinawanOsageOttawaPaiutePakistaniPalestinianPanamanianParaguayanPennsylvania GermanPeruvianPimaPolishPortuguesePotawatomiPuebloPuerto RicanPuget Sound SalishRomanianRussianSalvadoranSamoanScandinavianScotch-IrishScottishSeminoleSenegaleseSerbianShoshoneSierra LeoneanSiouxSlavicSlovakSloveneSomaliSouth AfricanSouth AmericanSouth American IndianSoviet UnionSpaniardSpanishSpanish AmericanSpanish American IndianSri LankanSubsaharan AfricanSudaneseSwedishSwissSyrianTaiwaneseThaiTlingit-HaidaTohono O'OdhamTonganTrinidadian and TobagonianTsimshianTurkishU.S. Virgin IslanderUgandanUkrainianUruguayanUteVenezuelanVietnameseWelshWest IndianYakamaYaquiYugoslavianYumanYup'ikZimbabwean
Immigration
NonimmigrantsImmigrantsAfghanistanAfricaAlbaniaArgentinaArmeniaAsiaAustraliaAustriaBahamasBangladeshBarbadosBelarusBelgiumBelizeBoliviaBosnia and HerzegovinaBrazilBulgariaBurma/MyanmarCabo VerdeCambodiaCameroonCanadaCaribbeanCentral AmericaChileChinaColombiaCongoCosta RicaCroatiaCubaCzechoslovakiaDenmarkDominicaDominican RepublicEastern AfricaEastern AsiaEastern EuropeEcuadorEgyptEl SalvadorEnglandEritreaEthiopiaEuropeFijiFranceGermanyGhanaGreeceGrenadaGuatemalaGuyanaHaitiHondurasHong KongHungaryIndiaIndonesiaIranIraqIrelandIsraelItalyJamaicaJapanJordanKazakhstanKenyaKoreaKuwaitLaosLatin AmericaLatviaLebanonLiberiaLithuaniaMexicoMicronesiaMiddle AfricaMoldovaMoroccoNepalNetherlandsNicaraguaNigeriaNorth AmericaNorth MacedoniaNorthern AfricaNorthern EuropeNorwayOceaniaPakistanPanamaPeruPhilippinesPolandPortugalRomaniaRussiaSaudi ArabiaScotlandSenegalSerbiaSierra LeoneSingaporeSomaliaSouth AfricaSouth AmericaSouth Central AsiaSouth Eastern AsiaSouthern EuropeSpainSri LankaSt. Vincent and the GrenadinesSudanSwedenSwitzerlandSyriaTaiwanThailandTrinidad and TobagoTurkeyUgandaUkraineUruguayUzbekistanVenezuelaVietnamWest IndiesWestern AfricaWestern AsiaWestern EuropeYemenZaireZimbabweAzores
Poverty
Income
Poverty
Unemployment
Labor Participation
Family Structure
Vehicle Availability
Education Level
Disability

Poverty Comparison

Immigrants from Malaysia

Immigrants from Uruguay

Good
Poor
12.0%
POVERTY
72.7/ 100
METRIC RATING
149th/ 347
METRIC RANK
12.8%
POVERTY
15.6/ 100
METRIC RATING
202nd/ 347
METRIC RANK

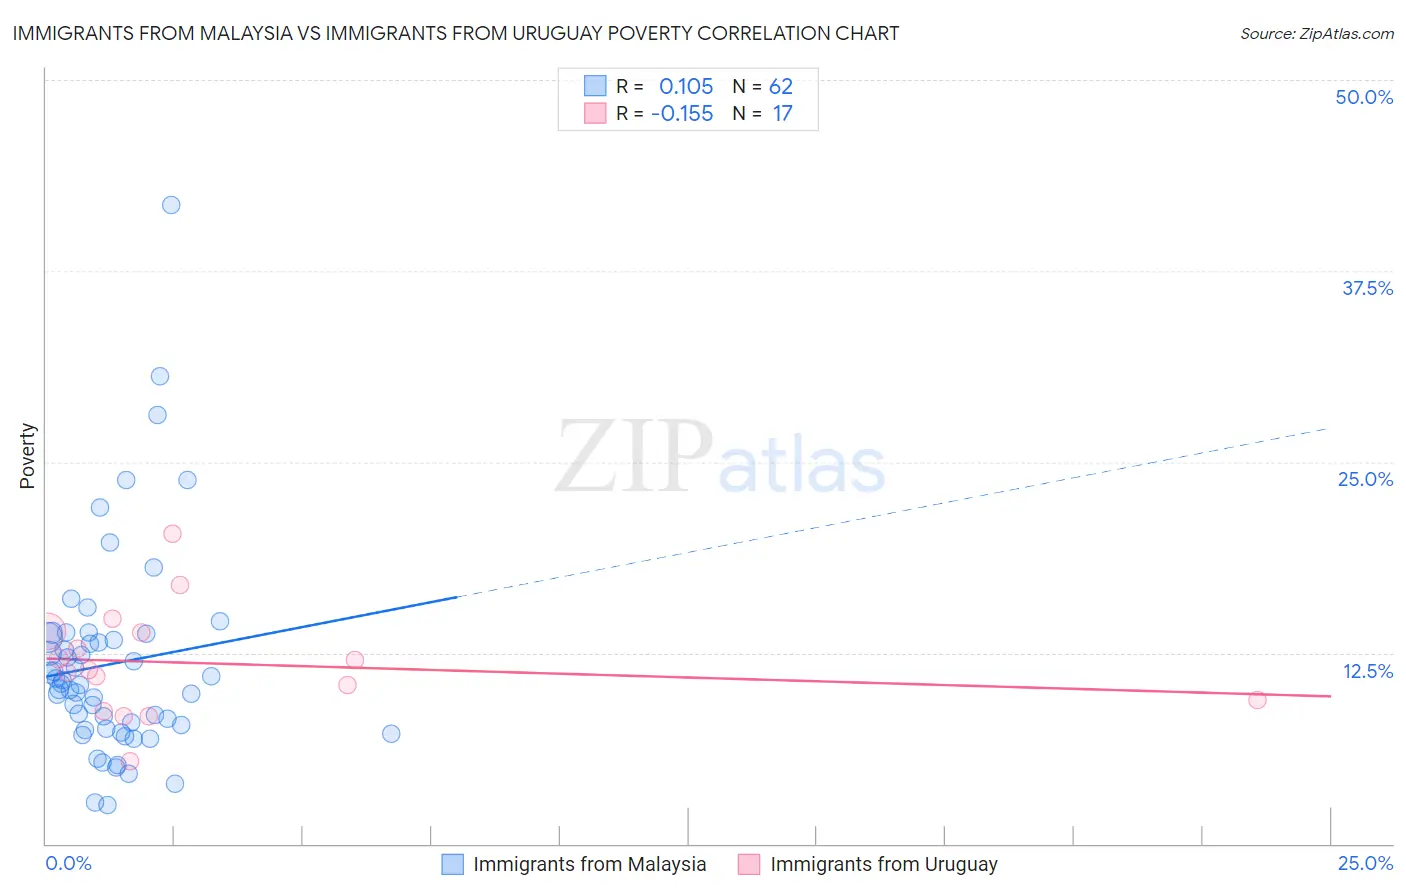
Immigrants from Malaysia vs Immigrants from Uruguay Poverty Correlation Chart

The statistical analysis conducted on geographies consisting of 197,932,153 people shows a poor positive correlation between the proportion of Immigrants from Malaysia and poverty level in the United States with a correlation coefficient (R) of 0.105 and weighted average of 12.0%. Similarly, the statistical analysis conducted on geographies consisting of 133,245,054 people shows a poor negative correlation between the proportion of Immigrants from Uruguay and poverty level in the United States with a correlation coefficient (R) of -0.155 and weighted average of 12.8%, a difference of 6.6%.
Immigrants from Malaysia vs Immigrants from Uruguay Poverty

Poverty Correlation Summary

MeasurementImmigrants from MalaysiaImmigrants from Uruguay
Minimum2.6%5.4%
Maximum41.8%20.3%
Range39.3%14.9%
Mean11.8%11.8%
Median10.4%11.4%
Interquartile 25% (IQ1)7.5%9.0%
Interquartile 75% (IQ3)13.5%13.9%
Interquartile Range (IQR)6.0%4.8%
Standard Deviation (Sample)6.8%3.5%
Standard Deviation (Population)6.8%3.4%

Similar Demographics by Poverty

Demographics Similar to Immigrants from Malaysia by Poverty

In terms of poverty, the demographic groups most similar to Immigrants from Malaysia are Immigrants from Germany (12.0%, a difference of 0.0%), Immigrants from Kazakhstan (12.0%, a difference of 0.050%), Samoan (12.0%, a difference of 0.090%), Immigrants from Bosnia and Herzegovina (12.0%, a difference of 0.12%), and Afghan (12.0%, a difference of 0.28%).
DemographicsRating | RankPoverty
Basques
80.4
/100
|
#142
Excellent
11.9%
Brazilians
79.7
/100
|
#143
Good
11.9%
Icelanders
77.9
/100
|
#144
Good
11.9%
Syrians
75.1
/100
|
#145
Good
12.0%
Afghans
74.9
/100
|
#146
Good
12.0%
Immigrants | Bosnia and Herzegovina
73.7
/100
|
#147
Good
12.0%
Immigrants | Germany
72.7
/100
|
#148
Good
12.0%
Immigrants | Malaysia
72.7
/100
|
#149
Good
12.0%
Immigrants | Kazakhstan
72.3
/100
|
#150
Good
12.0%
Samoans
71.9
/100
|
#151
Good
12.0%
Armenians
67.6
/100
|
#152
Good
12.1%
Immigrants | Northern Africa
63.9
/100
|
#153
Good
12.1%
Guamanians/Chamorros
63.9
/100
|
#154
Good
12.1%
Hungarians
63.6
/100
|
#155
Good
12.2%
Scotch-Irish
62.6
/100
|
#156
Good
12.2%

Demographics Similar to Immigrants from Uruguay by Poverty

In terms of poverty, the demographic groups most similar to Immigrants from Uruguay are Hmong (12.8%, a difference of 0.10%), Spaniard (12.8%, a difference of 0.16%), Immigrants from Uganda (12.8%, a difference of 0.16%), Immigrants from Western Asia (12.9%, a difference of 0.26%), and Immigrants from Kenya (12.8%, a difference of 0.32%).
DemographicsRating | RankPoverty
Immigrants | Kuwait
20.9
/100
|
#195
Fair
12.7%
Iraqis
20.8
/100
|
#196
Fair
12.7%
Immigrants | Lebanon
18.7
/100
|
#197
Poor
12.8%
Spanish
18.7
/100
|
#198
Poor
12.8%
Immigrants | Kenya
17.5
/100
|
#199
Poor
12.8%
Spaniards
16.5
/100
|
#200
Poor
12.8%
Immigrants | Uganda
16.5
/100
|
#201
Poor
12.8%
Immigrants | Uruguay
15.6
/100
|
#202
Poor
12.8%
Hmong
15.0
/100
|
#203
Poor
12.8%
Immigrants | Western Asia
14.1
/100
|
#204
Poor
12.9%
Tsimshian
9.2
/100
|
#205
Tragic
13.0%
Immigrants | Eastern Africa
7.0
/100
|
#206
Tragic
13.1%
Panamanians
6.6
/100
|
#207
Tragic
13.1%
Ugandans
6.2
/100
|
#208
Tragic
13.1%
Malaysians
6.1
/100
|
#209
Tragic
13.1%