Immigrants from Liberia vs Subsaharan African Child Poverty Under the Age of 5
COMPARE
Immigrants from Liberia
Subsaharan African
Child Poverty Under the Age of 5
Child Poverty Under the Age of 5 Comparison
Immigrants from Liberia
Sub-Saharan Africans
20.2%
CHILD POVERTY UNDER THE AGE OF 5
0.1/ 100
METRIC RATING
264th/ 347
METRIC RANK
20.8%
CHILD POVERTY UNDER THE AGE OF 5
0.0/ 100
METRIC RATING
279th/ 347
METRIC RANK
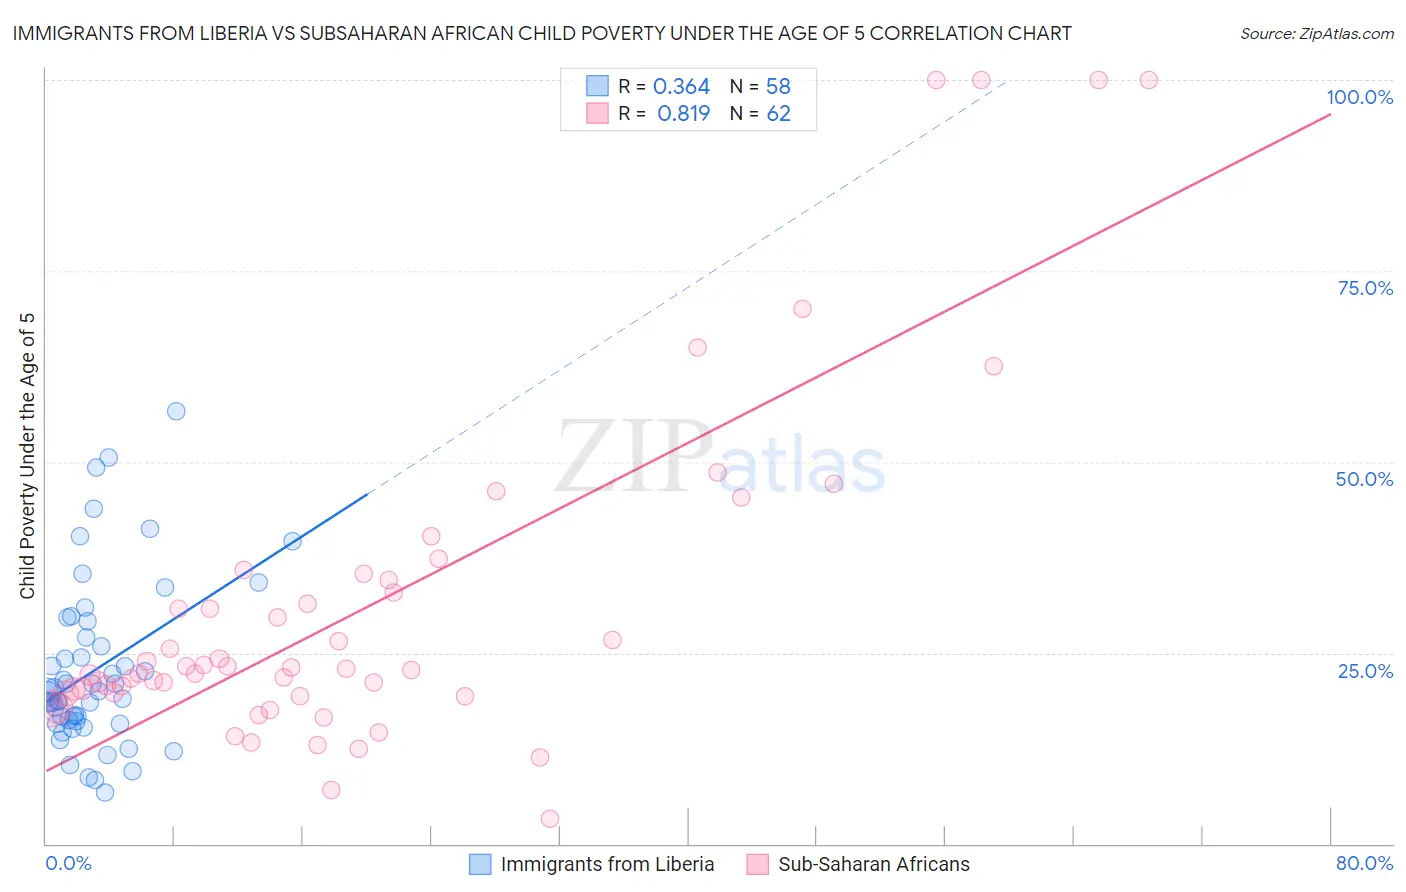
Immigrants from Liberia vs Subsaharan African Child Poverty Under the Age of 5 Correlation Chart
The statistical analysis conducted on geographies consisting of 133,700,788 people shows a mild positive correlation between the proportion of Immigrants from Liberia and poverty level among children under the age of 5 in the United States with a correlation coefficient (R) of 0.364 and weighted average of 20.2%. Similarly, the statistical analysis conducted on geographies consisting of 484,697,114 people shows a very strong positive correlation between the proportion of Sub-Saharan Africans and poverty level among children under the age of 5 in the United States with a correlation coefficient (R) of 0.819 and weighted average of 20.8%, a difference of 2.7%.
Child Poverty Under the Age of 5 Correlation Summary
| Measurement | Immigrants from Liberia | Subsaharan African |
| Minimum | 6.7% | 3.3% |
| Maximum | 56.7% | 100.0% |
| Range | 50.0% | 96.7% |
| Mean | 22.7% | 30.9% |
| Median | 19.9% | 22.8% |
| Interquartile 25% (IQ1) | 16.1% | 19.6% |
| Interquartile 75% (IQ3) | 27.0% | 34.5% |
| Interquartile Range (IQR) | 11.0% | 14.9% |
| Standard Deviation (Sample) | 10.9% | 22.3% |
| Standard Deviation (Population) | 10.8% | 22.2% |
Demographics Similar to Immigrants from Liberia and Sub-Saharan Africans by Child Poverty Under the Age of 5
In terms of child poverty under the age of 5, the demographic groups most similar to Immigrants from Liberia are Barbadian (20.2%, a difference of 0.12%), Spanish American Indian (20.2%, a difference of 0.12%), Liberian (20.2%, a difference of 0.19%), Aleut (20.3%, a difference of 0.24%), and Immigrants from Bangladesh (20.1%, a difference of 0.60%). Similarly, the demographic groups most similar to Sub-Saharan Africans are Immigrants from Grenada (20.7%, a difference of 0.37%), Immigrants from West Indies (20.7%, a difference of 0.39%), French American Indian (20.8%, a difference of 0.41%), West Indian (20.6%, a difference of 0.56%), and Senegalese (20.9%, a difference of 0.64%).
| Demographics | Rating | Rank | Child Poverty Under the Age of 5 |
| Immigrants | Bangladesh | 0.2 /100 | #261 | Tragic 20.1% |
| Liberians | 0.1 /100 | #262 | Tragic 20.2% |
| Barbadians | 0.1 /100 | #263 | Tragic 20.2% |
| Immigrants | Liberia | 0.1 /100 | #264 | Tragic 20.2% |
| Spanish American Indians | 0.1 /100 | #265 | Tragic 20.2% |
| Aleuts | 0.1 /100 | #266 | Tragic 20.3% |
| Ottawa | 0.1 /100 | #267 | Tragic 20.3% |
| Belizeans | 0.1 /100 | #268 | Tragic 20.3% |
| Immigrants | Burma/Myanmar | 0.1 /100 | #269 | Tragic 20.4% |
| Jamaicans | 0.1 /100 | #270 | Tragic 20.4% |
| Americans | 0.1 /100 | #271 | Tragic 20.5% |
| Immigrants | Jamaica | 0.1 /100 | #272 | Tragic 20.5% |
| Central Americans | 0.1 /100 | #273 | Tragic 20.6% |
| Immigrants | Belize | 0.1 /100 | #274 | Tragic 20.6% |
| Bangladeshis | 0.1 /100 | #275 | Tragic 20.6% |
| West Indians | 0.0 /100 | #276 | Tragic 20.6% |
| Immigrants | West Indies | 0.0 /100 | #277 | Tragic 20.7% |
| Immigrants | Grenada | 0.0 /100 | #278 | Tragic 20.7% |
| Sub-Saharan Africans | 0.0 /100 | #279 | Tragic 20.8% |
| French American Indians | 0.0 /100 | #280 | Tragic 20.8% |
| Senegalese | 0.0 /100 | #281 | Tragic 20.9% |