Immigrants from Latin America vs Indian (Asian) Child Poverty Under the Age of 16
COMPARE
Immigrants from Latin America
Indian (Asian)
Child Poverty Under the Age of 16
Child Poverty Under the Age of 16 Comparison
Immigrants from Latin America
Indians (Asian)
20.5%
CHILD POVERTY UNDER THE AGE OF 16
0.0/ 100
METRIC RATING
292nd/ 347
METRIC RANK
13.1%
CHILD POVERTY UNDER THE AGE OF 16
99.8/ 100
METRIC RATING
23rd/ 347
METRIC RANK
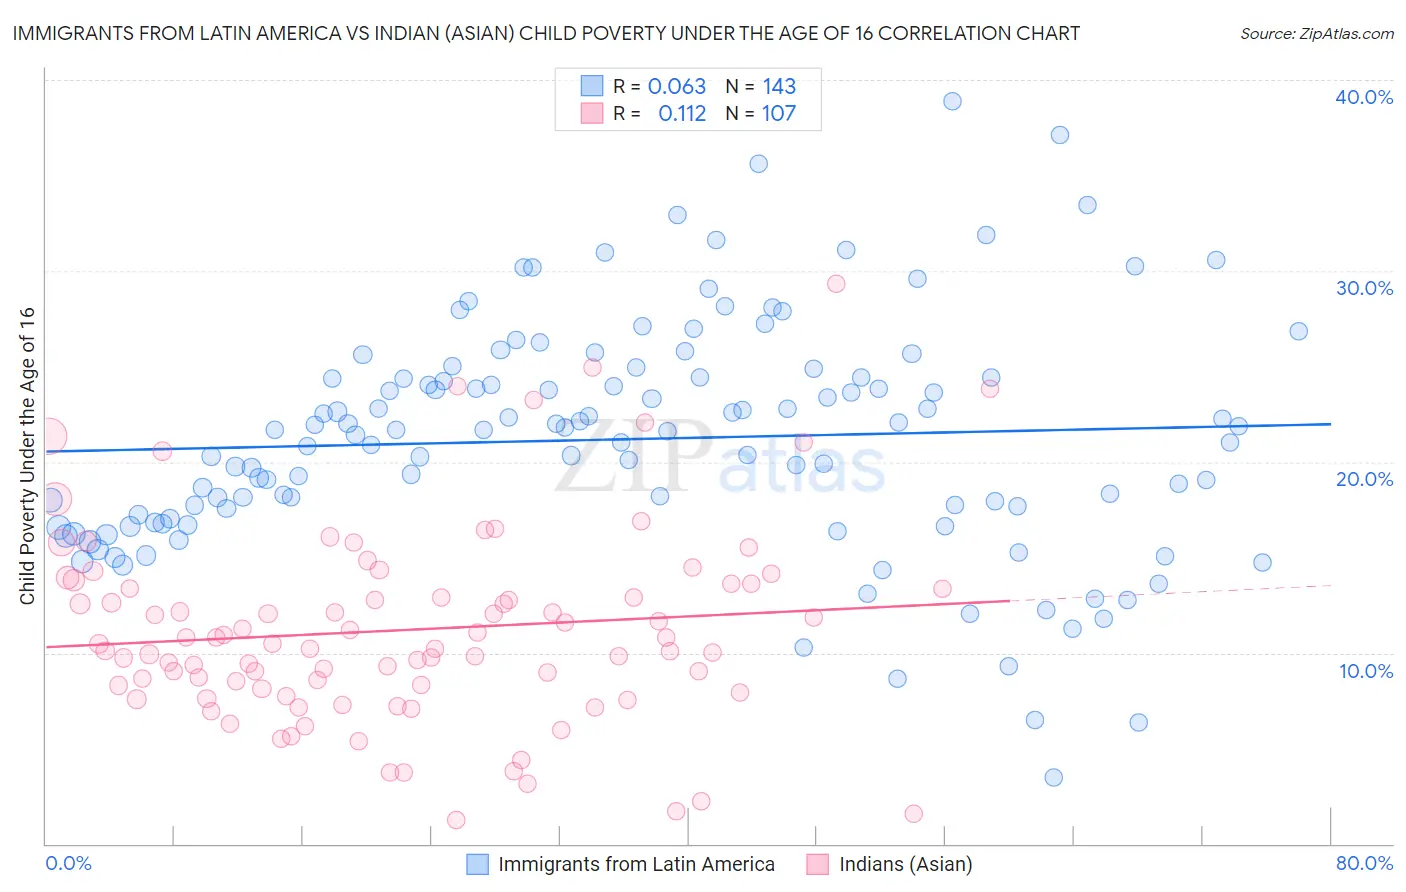
Immigrants from Latin America vs Indian (Asian) Child Poverty Under the Age of 16 Correlation Chart
The statistical analysis conducted on geographies consisting of 548,259,173 people shows a slight positive correlation between the proportion of Immigrants from Latin America and poverty level among children under the age of 16 in the United States with a correlation coefficient (R) of 0.063 and weighted average of 20.5%. Similarly, the statistical analysis conducted on geographies consisting of 487,871,555 people shows a poor positive correlation between the proportion of Indians (Asian) and poverty level among children under the age of 16 in the United States with a correlation coefficient (R) of 0.112 and weighted average of 13.1%, a difference of 56.1%.
Child Poverty Under the Age of 16 Correlation Summary
| Measurement | Immigrants from Latin America | Indian (Asian) |
| Minimum | 3.5% | 1.3% |
| Maximum | 38.9% | 29.3% |
| Range | 35.4% | 28.0% |
| Mean | 21.2% | 11.2% |
| Median | 21.6% | 10.4% |
| Interquartile 25% (IQ1) | 17.0% | 8.1% |
| Interquartile 75% (IQ3) | 24.4% | 13.6% |
| Interquartile Range (IQR) | 7.4% | 5.5% |
| Standard Deviation (Sample) | 6.1% | 5.2% |
| Standard Deviation (Population) | 6.1% | 5.1% |
Similar Demographics by Child Poverty Under the Age of 16
Demographics Similar to Immigrants from Latin America by Child Poverty Under the Age of 16
In terms of child poverty under the age of 16, the demographic groups most similar to Immigrants from Latin America are Chippewa (20.5%, a difference of 0.040%), Immigrants from Senegal (20.6%, a difference of 0.43%), Haitian (20.7%, a difference of 0.64%), Mexican (20.7%, a difference of 0.77%), and Yaqui (20.4%, a difference of 0.79%).
| Demographics | Rating | Rank | Child Poverty Under the Age of 16 |
| Immigrants | St. Vincent and the Grenadines | 0.0 /100 | #285 | Tragic 20.1% |
| Immigrants | West Indies | 0.0 /100 | #286 | Tragic 20.2% |
| Blackfeet | 0.0 /100 | #287 | Tragic 20.2% |
| Immigrants | Belize | 0.0 /100 | #288 | Tragic 20.3% |
| Senegalese | 0.0 /100 | #289 | Tragic 20.4% |
| Yaqui | 0.0 /100 | #290 | Tragic 20.4% |
| Chippewa | 0.0 /100 | #291 | Tragic 20.5% |
| Immigrants | Latin America | 0.0 /100 | #292 | Tragic 20.5% |
| Immigrants | Senegal | 0.0 /100 | #293 | Tragic 20.6% |
| Haitians | 0.0 /100 | #294 | Tragic 20.7% |
| Mexicans | 0.0 /100 | #295 | Tragic 20.7% |
| Immigrants | Caribbean | 0.0 /100 | #296 | Tragic 20.8% |
| Hispanics or Latinos | 0.0 /100 | #297 | Tragic 20.8% |
| Arapaho | 0.0 /100 | #298 | Tragic 20.8% |
| Immigrants | Haiti | 0.0 /100 | #299 | Tragic 20.9% |
Demographics Similar to Indians (Asian) by Child Poverty Under the Age of 16
In terms of child poverty under the age of 16, the demographic groups most similar to Indians (Asian) are Maltese (13.1%, a difference of 0.040%), Immigrants from Eastern Asia (13.1%, a difference of 0.12%), Okinawan (13.1%, a difference of 0.15%), Latvian (13.2%, a difference of 0.21%), and Eastern European (13.2%, a difference of 0.29%).
| Demographics | Rating | Rank | Child Poverty Under the Age of 16 |
| Norwegians | 99.9 /100 | #16 | Exceptional 13.0% |
| Bulgarians | 99.9 /100 | #17 | Exceptional 13.0% |
| Cypriots | 99.9 /100 | #18 | Exceptional 13.0% |
| Immigrants | Japan | 99.8 /100 | #19 | Exceptional 13.0% |
| Okinawans | 99.8 /100 | #20 | Exceptional 13.1% |
| Immigrants | Eastern Asia | 99.8 /100 | #21 | Exceptional 13.1% |
| Maltese | 99.8 /100 | #22 | Exceptional 13.1% |
| Indians (Asian) | 99.8 /100 | #23 | Exceptional 13.1% |
| Latvians | 99.8 /100 | #24 | Exceptional 13.2% |
| Eastern Europeans | 99.8 /100 | #25 | Exceptional 13.2% |
| Bolivians | 99.8 /100 | #26 | Exceptional 13.2% |
| Immigrants | China | 99.8 /100 | #27 | Exceptional 13.3% |
| Assyrians/Chaldeans/Syriacs | 99.7 /100 | #28 | Exceptional 13.3% |
| Swedes | 99.7 /100 | #29 | Exceptional 13.3% |
| Turks | 99.7 /100 | #30 | Exceptional 13.4% |