Immigrants from Italy vs Hispanic or Latino Child Poverty Among Girls Under 16

COMPARE

Immigrants from Italy
Race
Ancestry
AfghanAfricanAlaska NativeAlaskan AthabascanAlbanianAleutAlsatianAmericanApacheArabArapahoArgentineanArmenianAssyrian/Chaldean/SyriacAustralianAustrianBahamianBangladeshiBarbadianBasqueBelgianBelizeanBermudanBhutaneseBlackfeetBolivianBrazilianBritishBritish West IndianBulgarianBurmeseCajunCambodianCanadianCape VerdeanCarpatho RusynCelticCentral AmericanCentral American IndianCherokeeCheyenneChickasawChileanChineseChippewaChoctawColombianColvilleComancheCosta RicanCreeCreekCroatianCrowCubanCypriotCzechCzechoslovakianDanishDelawareDominicanDutchDutch West IndianEastern EuropeanEcuadorianEgyptianEnglishEstonianEthiopianEuropeanFijianFilipinoFinnishFrenchFrench American IndianFrench CanadianGermanGerman RussianGhanaianGreekGuamanian/ChamorroGuatemalanGuyaneseHaitianHmongHonduranHopiHoumaHungarianIcelanderIndian (Asian)IndonesianInupiatIranianIraqiIrishIroquoisIsraeliItalianJamaicanJapaneseJordanianKenyanKiowaKoreanLaotianLatvianLebaneseLiberianLithuanianLumbeeLuxembourgerMacedonianMalaysianMalteseMarshalleseMenomineeMexicanMexican American IndianMongolianMoroccanNative HawaiianNavajoNepaleseNew ZealanderNicaraguanNigerianNorthern EuropeanNorwegianOkinawanOsageOttawaPaiutePakistaniPalestinianPanamanianParaguayanPennsylvania GermanPeruvianPimaPolishPortuguesePotawatomiPuebloPuerto RicanPuget Sound SalishRomanianRussianSalvadoranSamoanScandinavianScotch-IrishScottishSeminoleSenegaleseSerbianShoshoneSierra LeoneanSiouxSlavicSlovakSloveneSomaliSouth AfricanSouth AmericanSouth American IndianSoviet UnionSpaniardSpanishSpanish AmericanSpanish American IndianSri LankanSubsaharan AfricanSudaneseSwedishSwissSyrianTaiwaneseThaiTlingit-HaidaTohono O'OdhamTonganTrinidadian and TobagonianTsimshianTurkishU.S. Virgin IslanderUgandanUkrainianUruguayanUteVenezuelanVietnameseWelshWest IndianYakamaYaquiYugoslavianYumanYup'ikZimbabwean
Immigration
NonimmigrantsImmigrantsAfghanistanAfricaAlbaniaArgentinaArmeniaAsiaAustraliaAustriaBahamasBangladeshBarbadosBelarusBelgiumBelizeBoliviaBosnia and HerzegovinaBrazilBulgariaBurma/MyanmarCabo VerdeCambodiaCameroonCanadaCaribbeanCentral AmericaChileChinaColombiaCongoCosta RicaCroatiaCubaCzechoslovakiaDenmarkDominicaDominican RepublicEastern AfricaEastern AsiaEastern EuropeEcuadorEgyptEl SalvadorEnglandEritreaEthiopiaEuropeFijiFranceGermanyGhanaGreeceGrenadaGuatemalaGuyanaHaitiHondurasHong KongHungaryIndiaIndonesiaIranIraqIrelandIsraelItalyJamaicaJapanJordanKazakhstanKenyaKoreaKuwaitLaosLatin AmericaLatviaLebanonLiberiaLithuaniaMalaysiaMexicoMicronesiaMiddle AfricaMoldovaMoroccoNepalNetherlandsNicaraguaNigeriaNorth AmericaNorth MacedoniaNorthern AfricaNorthern EuropeNorwayOceaniaPakistanPanamaPeruPhilippinesPolandPortugalRomaniaRussiaSaudi ArabiaScotlandSenegalSerbiaSierra LeoneSingaporeSomaliaSouth AfricaSouth AmericaSouth Central AsiaSouth Eastern AsiaSouthern EuropeSpainSri LankaSt. Vincent and the GrenadinesSudanSwedenSwitzerlandSyriaTaiwanThailandTrinidad and TobagoTurkeyUgandaUkraineUruguayUzbekistanVenezuelaVietnamWest IndiesWestern AfricaWestern AsiaWestern EuropeYemenZaireZimbabweAzores
Hispanic or Latino
Race
Ancestry
AfghanAfricanAlaska NativeAlaskan AthabascanAlbanianAleutAlsatianAmericanApacheArabArapahoArgentineanArmenianAssyrian/Chaldean/SyriacAustralianAustrianBahamianBangladeshiBarbadianBasqueBelgianBelizeanBermudanBhutaneseBlackfeetBolivianBrazilianBritishBritish West IndianBulgarianBurmeseCajunCambodianCanadianCape VerdeanCarpatho RusynCelticCentral AmericanCentral American IndianCherokeeCheyenneChickasawChileanChineseChippewaChoctawColombianColvilleComancheCosta RicanCreeCreekCroatianCrowCubanCypriotCzechCzechoslovakianDanishDelawareDominicanDutchDutch West IndianEastern EuropeanEcuadorianEgyptianEnglishEstonianEthiopianEuropeanFijianFilipinoFinnishFrenchFrench American IndianFrench CanadianGermanGerman RussianGhanaianGreekGuamanian/ChamorroGuatemalanGuyaneseHaitianHmongHonduranHopiHoumaHungarianIcelanderIndian (Asian)IndonesianInupiatIranianIraqiIrishIroquoisIsraeliItalianJamaicanJapaneseJordanianKenyanKiowaKoreanLaotianLatvianLebaneseLiberianLithuanianLumbeeLuxembourgerMacedonianMalaysianMalteseMarshalleseMenomineeMexicanMexican American IndianMongolianMoroccanNative HawaiianNavajoNepaleseNew ZealanderNicaraguanNigerianNorthern EuropeanNorwegianOkinawanOsageOttawaPaiutePakistaniPalestinianPanamanianParaguayanPennsylvania GermanPeruvianPimaPolishPortuguesePotawatomiPuebloPuerto RicanPuget Sound SalishRomanianRussianSalvadoranSamoanScandinavianScotch-IrishScottishSeminoleSenegaleseSerbianShoshoneSierra LeoneanSiouxSlavicSlovakSloveneSomaliSouth AfricanSouth AmericanSouth American IndianSoviet UnionSpaniardSpanishSpanish AmericanSpanish American IndianSri LankanSubsaharan AfricanSudaneseSwedishSwissSyrianTaiwaneseThaiTlingit-HaidaTohono O'OdhamTonganTrinidadian and TobagonianTsimshianTurkishU.S. Virgin IslanderUgandanUkrainianUruguayanUteVenezuelanVietnameseWelshWest IndianYakamaYaquiYugoslavianYumanYup'ikZimbabwean
Immigration
NonimmigrantsImmigrantsAfghanistanAfricaAlbaniaArgentinaArmeniaAsiaAustraliaAustriaBahamasBangladeshBarbadosBelarusBelgiumBelizeBoliviaBosnia and HerzegovinaBrazilBulgariaBurma/MyanmarCabo VerdeCambodiaCameroonCanadaCaribbeanCentral AmericaChileChinaColombiaCongoCosta RicaCroatiaCubaCzechoslovakiaDenmarkDominicaDominican RepublicEastern AfricaEastern AsiaEastern EuropeEcuadorEgyptEl SalvadorEnglandEritreaEthiopiaEuropeFijiFranceGermanyGhanaGreeceGrenadaGuatemalaGuyanaHaitiHondurasHong KongHungaryIndiaIndonesiaIranIraqIrelandIsraelJamaicaJapanJordanKazakhstanKenyaKoreaKuwaitLaosLatin AmericaLatviaLebanonLiberiaLithuaniaMalaysiaMexicoMicronesiaMiddle AfricaMoldovaMoroccoNepalNetherlandsNicaraguaNigeriaNorth AmericaNorth MacedoniaNorthern AfricaNorthern EuropeNorwayOceaniaPakistanPanamaPeruPhilippinesPolandPortugalRomaniaRussiaSaudi ArabiaScotlandSenegalSerbiaSierra LeoneSingaporeSomaliaSouth AfricaSouth AmericaSouth Central AsiaSouth Eastern AsiaSouthern EuropeSpainSri LankaSt. Vincent and the GrenadinesSudanSwedenSwitzerlandSyriaTaiwanThailandTrinidad and TobagoTurkeyUgandaUkraineUruguayUzbekistanVenezuelaVietnamWest IndiesWestern AfricaWestern AsiaWestern EuropeYemenZaireZimbabweAzores
Child Poverty Among Girls Under 16
Income
Poverty
Unemployment
Labor Participation
Family Structure
Vehicle Availability
Education Level
Disability

Child Poverty Among Girls Under 16 Comparison

Immigrants from Italy

Hispanics or Latinos

Exceptional
Tragic
14.8%
CHILD POVERTY AMONG GIRLS UNDER 16
97.4/ 100
METRIC RATING
83rd/ 347
METRIC RANK
21.0%
CHILD POVERTY AMONG GIRLS UNDER 16
0.0/ 100
METRIC RATING
299th/ 347
METRIC RANK

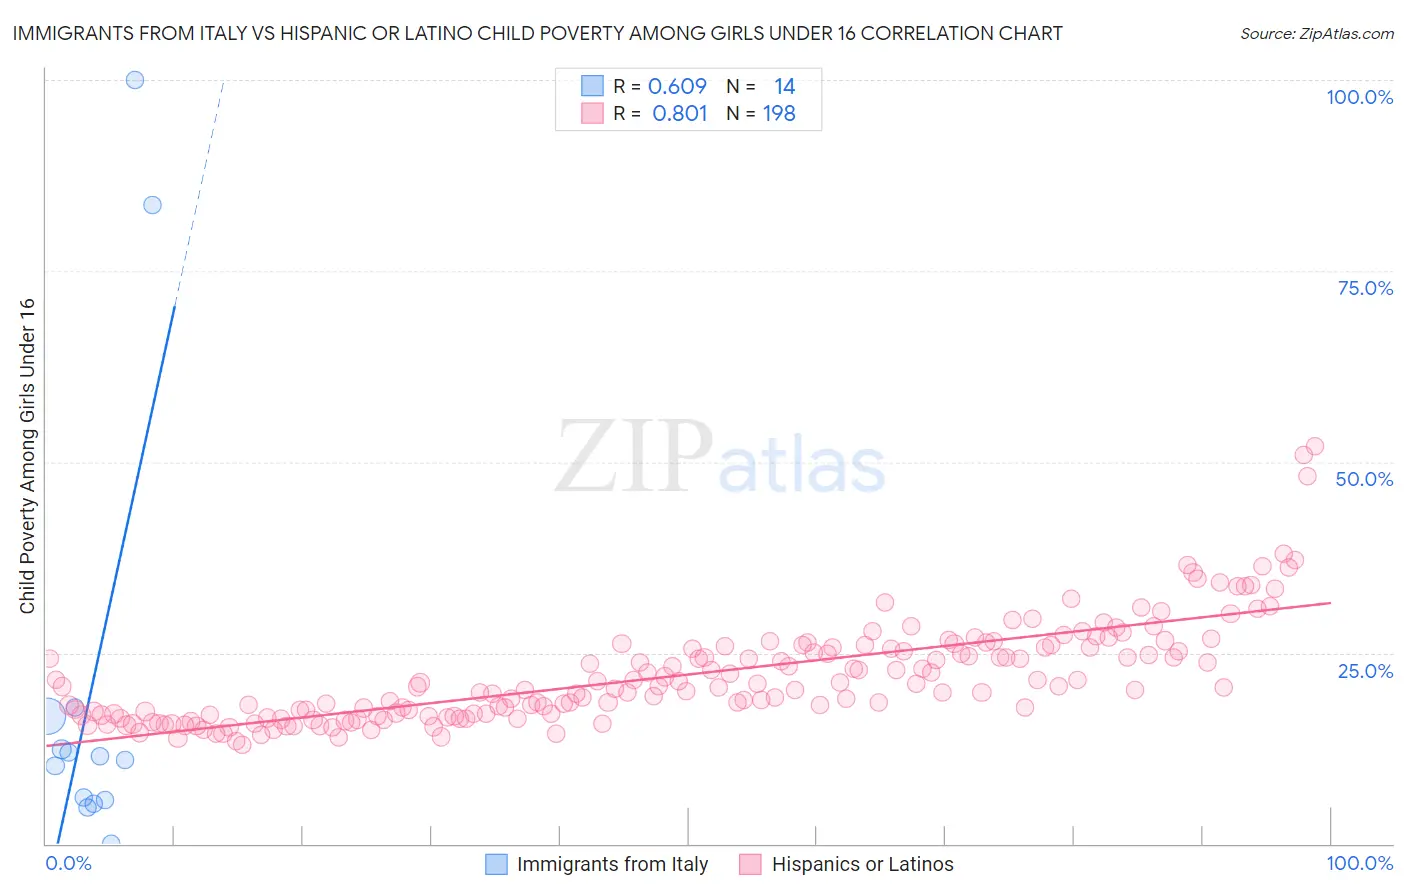
Immigrants from Italy vs Hispanic or Latino Child Poverty Among Girls Under 16 Correlation Chart

The statistical analysis conducted on geographies consisting of 317,038,083 people shows a significant positive correlation between the proportion of Immigrants from Italy and poverty level among girls under the age of 16 in the United States with a correlation coefficient (R) of 0.609 and weighted average of 14.8%. Similarly, the statistical analysis conducted on geographies consisting of 552,365,780 people shows a very strong positive correlation between the proportion of Hispanics or Latinos and poverty level among girls under the age of 16 in the United States with a correlation coefficient (R) of 0.801 and weighted average of 21.0%, a difference of 41.9%.
Immigrants from Italy vs Hispanic or Latino Child Poverty Among Girls Under 16

Child Poverty Among Girls Under 16 Correlation Summary

MeasurementImmigrants from ItalyHispanic or Latino
Minimum0.033%12.9%
Maximum100.0%52.1%
Range100.0%39.2%
Mean21.2%22.1%
Median11.2%20.5%
Interquartile 25% (IQ1)5.7%16.9%
Interquartile 75% (IQ3)16.7%25.7%
Interquartile Range (IQR)11.0%8.8%
Standard Deviation (Sample)30.5%6.7%
Standard Deviation (Population)29.3%6.7%

Similar Demographics by Child Poverty Among Girls Under 16

Demographics Similar to Immigrants from Italy by Child Poverty Among Girls Under 16

In terms of child poverty among girls under 16, the demographic groups most similar to Immigrants from Italy are Soviet Union (14.8%, a difference of 0.070%), Swiss (14.8%, a difference of 0.19%), Australian (14.8%, a difference of 0.23%), Macedonian (14.7%, a difference of 0.25%), and Finnish (14.8%, a difference of 0.25%).
DemographicsRating | RankChild Poverty Among Girls Under 16
Immigrants | Russia
97.9
/100
|
#76
Exceptional
14.7%
Tlingit-Haida
97.9
/100
|
#77
Exceptional
14.7%
Argentineans
97.9
/100
|
#78
Exceptional
14.7%
Immigrants | Turkey
97.9
/100
|
#79
Exceptional
14.7%
Egyptians
97.9
/100
|
#80
Exceptional
14.7%
Ukrainians
97.7
/100
|
#81
Exceptional
14.7%
Macedonians
97.6
/100
|
#82
Exceptional
14.7%
Immigrants | Italy
97.4
/100
|
#83
Exceptional
14.8%
Soviet Union
97.3
/100
|
#84
Exceptional
14.8%
Swiss
97.2
/100
|
#85
Exceptional
14.8%
Australians
97.2
/100
|
#86
Exceptional
14.8%
Finns
97.2
/100
|
#87
Exceptional
14.8%
Immigrants | Canada
97.1
/100
|
#88
Exceptional
14.8%
Jordanians
97.1
/100
|
#89
Exceptional
14.8%
Northern Europeans
97.0
/100
|
#90
Exceptional
14.8%

Demographics Similar to Hispanics or Latinos by Child Poverty Among Girls Under 16

In terms of child poverty among girls under 16, the demographic groups most similar to Hispanics or Latinos are Somali (21.0%, a difference of 0.31%), Mexican (20.9%, a difference of 0.40%), Inupiat (20.8%, a difference of 0.93%), Choctaw (21.1%, a difference of 0.93%), and Immigrants from West Indies (20.7%, a difference of 1.0%).
DemographicsRating | RankChild Poverty Among Girls Under 16
Immigrants | Latin America
0.0
/100
|
#292
Tragic
20.6%
Immigrants | Grenada
0.0
/100
|
#293
Tragic
20.7%
Immigrants | Senegal
0.0
/100
|
#294
Tragic
20.7%
Immigrants | Caribbean
0.0
/100
|
#295
Tragic
20.7%
Immigrants | West Indies
0.0
/100
|
#296
Tragic
20.7%
Inupiat
0.0
/100
|
#297
Tragic
20.8%
Mexicans
0.0
/100
|
#298
Tragic
20.9%
Hispanics or Latinos
0.0
/100
|
#299
Tragic
21.0%
Somalis
0.0
/100
|
#300
Tragic
21.0%
Choctaw
0.0
/100
|
#301
Tragic
21.1%
Seminole
0.0
/100
|
#302
Tragic
21.2%
British West Indians
0.0
/100
|
#303
Tragic
21.3%
Indonesians
0.0
/100
|
#304
Tragic
21.3%
Guatemalans
0.0
/100
|
#305
Tragic
21.4%
Immigrants | Central America
0.0
/100
|
#306
Tragic
21.4%