Immigrants from Israel vs Tlingit-Haida Child Poverty Among Girls Under 16

COMPARE

Immigrants from Israel
Race
Ancestry
AfghanAfricanAlaska NativeAlaskan AthabascanAlbanianAleutAlsatianAmericanApacheArabArapahoArgentineanArmenianAssyrian/Chaldean/SyriacAustralianAustrianBahamianBangladeshiBarbadianBasqueBelgianBelizeanBermudanBhutaneseBlackfeetBolivianBrazilianBritishBritish West IndianBulgarianBurmeseCajunCambodianCanadianCape VerdeanCarpatho RusynCelticCentral AmericanCentral American IndianCherokeeCheyenneChickasawChileanChineseChippewaChoctawColombianColvilleComancheCosta RicanCreeCreekCroatianCrowCubanCypriotCzechCzechoslovakianDanishDelawareDominicanDutchDutch West IndianEastern EuropeanEcuadorianEgyptianEnglishEstonianEthiopianEuropeanFijianFilipinoFinnishFrenchFrench American IndianFrench CanadianGermanGerman RussianGhanaianGreekGuamanian/ChamorroGuatemalanGuyaneseHaitianHmongHonduranHopiHoumaHungarianIcelanderIndian (Asian)IndonesianInupiatIranianIraqiIrishIroquoisIsraeliItalianJamaicanJapaneseJordanianKenyanKiowaKoreanLaotianLatvianLebaneseLiberianLithuanianLumbeeLuxembourgerMacedonianMalaysianMalteseMarshalleseMenomineeMexicanMexican American IndianMongolianMoroccanNative HawaiianNavajoNepaleseNew ZealanderNicaraguanNigerianNorthern EuropeanNorwegianOkinawanOsageOttawaPaiutePakistaniPalestinianPanamanianParaguayanPennsylvania GermanPeruvianPimaPolishPortuguesePotawatomiPuebloPuerto RicanPuget Sound SalishRomanianRussianSalvadoranSamoanScandinavianScotch-IrishScottishSeminoleSenegaleseSerbianShoshoneSierra LeoneanSiouxSlavicSlovakSloveneSomaliSouth AfricanSouth AmericanSouth American IndianSoviet UnionSpaniardSpanishSpanish AmericanSpanish American IndianSri LankanSubsaharan AfricanSudaneseSwedishSwissSyrianTaiwaneseThaiTohono O'OdhamTonganTrinidadian and TobagonianTsimshianTurkishU.S. Virgin IslanderUgandanUkrainianUruguayanUteVenezuelanVietnameseWelshWest IndianYakamaYaquiYugoslavianYumanYup'ikZimbabwean
Immigration
NonimmigrantsImmigrantsAfghanistanAfricaAlbaniaArgentinaArmeniaAsiaAustraliaAustriaBahamasBangladeshBarbadosBelarusBelgiumBelizeBoliviaBosnia and HerzegovinaBrazilBulgariaBurma/MyanmarCabo VerdeCambodiaCameroonCanadaCaribbeanCentral AmericaChileChinaColombiaCongoCosta RicaCroatiaCubaCzechoslovakiaDenmarkDominicaDominican RepublicEastern AfricaEastern AsiaEastern EuropeEcuadorEgyptEl SalvadorEnglandEritreaEthiopiaEuropeFijiFranceGermanyGhanaGreeceGrenadaGuatemalaGuyanaHaitiHondurasHong KongHungaryIndiaIndonesiaIranIraqIrelandIsraelItalyJamaicaJapanJordanKazakhstanKenyaKoreaKuwaitLaosLatin AmericaLatviaLebanonLiberiaLithuaniaMalaysiaMexicoMicronesiaMiddle AfricaMoldovaMoroccoNepalNetherlandsNicaraguaNigeriaNorth AmericaNorth MacedoniaNorthern AfricaNorthern EuropeNorwayOceaniaPakistanPanamaPeruPhilippinesPolandPortugalRomaniaRussiaSaudi ArabiaScotlandSenegalSerbiaSierra LeoneSingaporeSomaliaSouth AfricaSouth AmericaSouth Central AsiaSouth Eastern AsiaSouthern EuropeSpainSri LankaSt. Vincent and the GrenadinesSudanSwedenSwitzerlandSyriaTaiwanThailandTrinidad and TobagoTurkeyUgandaUkraineUruguayUzbekistanVenezuelaVietnamWest IndiesWestern AfricaWestern AsiaWestern EuropeYemenZaireZimbabweAzores
Tlingit-Haida
Race
Ancestry
AfghanAfricanAlaska NativeAlaskan AthabascanAlbanianAleutAlsatianAmericanApacheArabArapahoArgentineanArmenianAssyrian/Chaldean/SyriacAustralianAustrianBahamianBangladeshiBarbadianBasqueBelgianBelizeanBermudanBhutaneseBlackfeetBolivianBrazilianBritishBritish West IndianBulgarianBurmeseCajunCambodianCanadianCape VerdeanCarpatho RusynCelticCentral AmericanCentral American IndianCherokeeCheyenneChickasawChileanChineseChippewaChoctawColombianColvilleComancheCosta RicanCreeCreekCroatianCrowCubanCypriotCzechCzechoslovakianDanishDelawareDominicanDutchDutch West IndianEastern EuropeanEcuadorianEgyptianEnglishEstonianEthiopianEuropeanFijianFilipinoFinnishFrenchFrench American IndianFrench CanadianGermanGerman RussianGhanaianGreekGuamanian/ChamorroGuatemalanGuyaneseHaitianHmongHonduranHopiHoumaHungarianIcelanderIndian (Asian)IndonesianInupiatIranianIraqiIrishIroquoisIsraeliItalianJamaicanJapaneseJordanianKenyanKiowaKoreanLaotianLatvianLebaneseLiberianLithuanianLumbeeLuxembourgerMacedonianMalaysianMalteseMarshalleseMenomineeMexicanMexican American IndianMongolianMoroccanNative HawaiianNavajoNepaleseNew ZealanderNicaraguanNigerianNorthern EuropeanNorwegianOkinawanOsageOttawaPaiutePakistaniPalestinianPanamanianParaguayanPennsylvania GermanPeruvianPimaPolishPortuguesePotawatomiPuebloPuerto RicanPuget Sound SalishRomanianRussianSalvadoranSamoanScandinavianScotch-IrishScottishSeminoleSenegaleseSerbianShoshoneSierra LeoneanSiouxSlavicSlovakSloveneSomaliSouth AfricanSouth AmericanSouth American IndianSoviet UnionSpaniardSpanishSpanish AmericanSpanish American IndianSri LankanSubsaharan AfricanSudaneseSwedishSwissSyrianTaiwaneseThaiTlingit-HaidaTohono O'OdhamTonganTrinidadian and TobagonianTsimshianTurkishU.S. Virgin IslanderUgandanUkrainianUruguayanUteVenezuelanVietnameseWelshWest IndianYakamaYaquiYugoslavianYumanYup'ikZimbabwean
Immigration
NonimmigrantsImmigrantsAfghanistanAfricaAlbaniaArgentinaArmeniaAsiaAustraliaAustriaBahamasBangladeshBarbadosBelarusBelgiumBelizeBoliviaBosnia and HerzegovinaBrazilBulgariaBurma/MyanmarCabo VerdeCambodiaCameroonCanadaCaribbeanCentral AmericaChileChinaColombiaCongoCosta RicaCroatiaCubaCzechoslovakiaDenmarkDominicaDominican RepublicEastern AfricaEastern AsiaEastern EuropeEcuadorEgyptEl SalvadorEnglandEritreaEthiopiaEuropeFijiFranceGermanyGhanaGreeceGrenadaGuatemalaGuyanaHaitiHondurasHong KongHungaryIndiaIndonesiaIranIraqIrelandItalyJamaicaJapanJordanKazakhstanKenyaKoreaKuwaitLaosLatin AmericaLatviaLebanonLiberiaLithuaniaMalaysiaMexicoMicronesiaMiddle AfricaMoldovaMoroccoNepalNetherlandsNicaraguaNigeriaNorth AmericaNorth MacedoniaNorthern AfricaNorthern EuropeNorwayOceaniaPakistanPanamaPeruPhilippinesPolandPortugalRomaniaRussiaSaudi ArabiaScotlandSenegalSerbiaSierra LeoneSingaporeSomaliaSouth AfricaSouth AmericaSouth Central AsiaSouth Eastern AsiaSouthern EuropeSpainSri LankaSt. Vincent and the GrenadinesSudanSwedenSwitzerlandSyriaTaiwanThailandTrinidad and TobagoTurkeyUgandaUkraineUruguayUzbekistanVenezuelaVietnamWest IndiesWestern AfricaWestern AsiaWestern EuropeYemenZaireZimbabweAzores
Child Poverty Among Girls Under 16
Income
Poverty
Unemployment
Labor Participation
Family Structure
Vehicle Availability
Education Level
Disability

Child Poverty Among Girls Under 16 Comparison

Immigrants from Israel

Tlingit-Haida

Exceptional
Exceptional
14.2%
CHILD POVERTY AMONG GIRLS UNDER 16
99.2/ 100
METRIC RATING
50th/ 347
METRIC RANK
14.7%
CHILD POVERTY AMONG GIRLS UNDER 16
97.9/ 100
METRIC RATING
77th/ 347
METRIC RANK

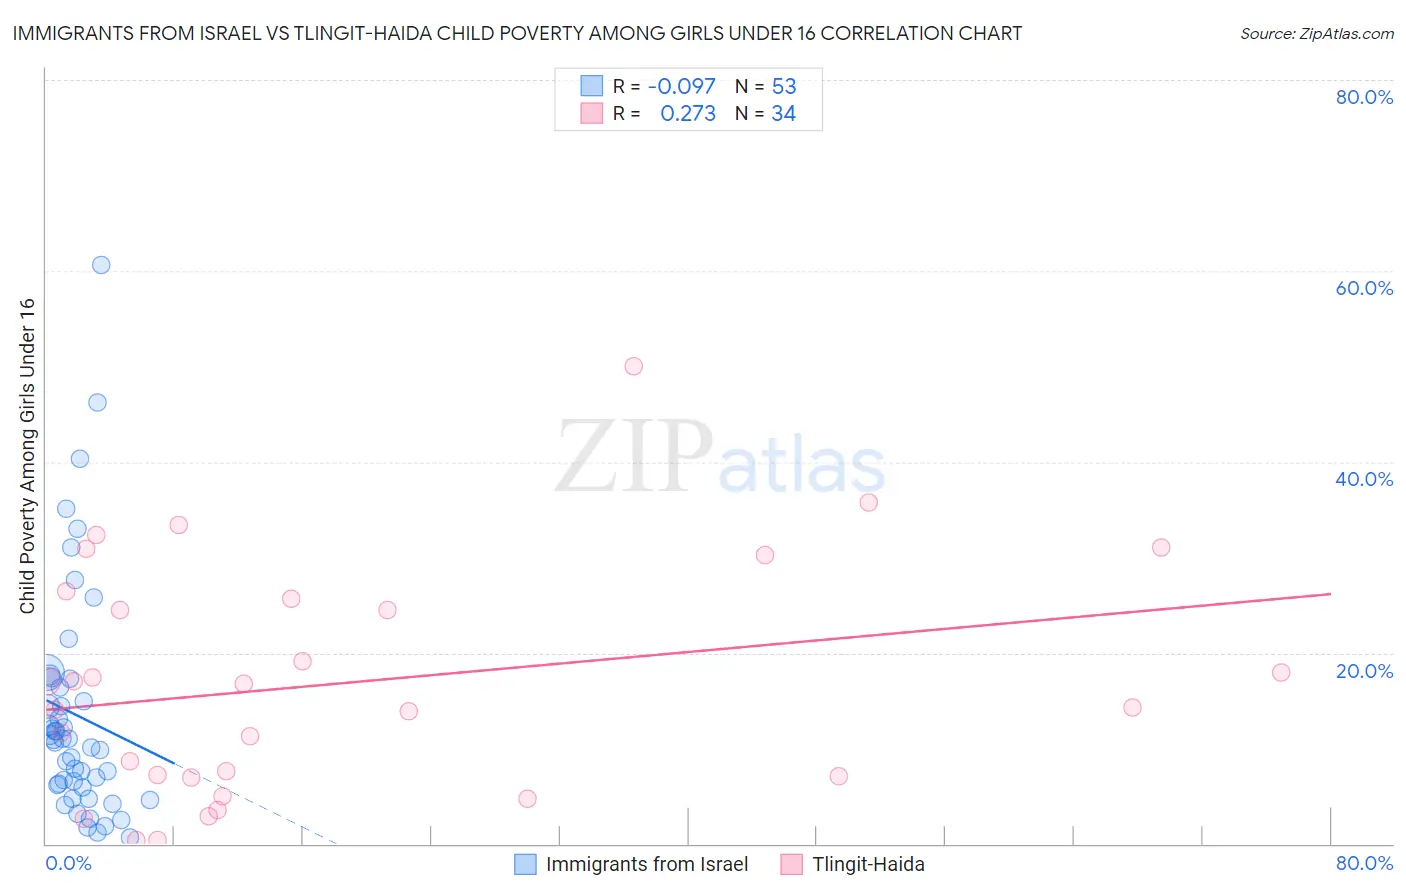
Immigrants from Israel vs Tlingit-Haida Child Poverty Among Girls Under 16 Correlation Chart

The statistical analysis conducted on geographies consisting of 206,961,742 people shows a slight negative correlation between the proportion of Immigrants from Israel and poverty level among girls under the age of 16 in the United States with a correlation coefficient (R) of -0.097 and weighted average of 14.2%. Similarly, the statistical analysis conducted on geographies consisting of 60,606,017 people shows a weak positive correlation between the proportion of Tlingit-Haida and poverty level among girls under the age of 16 in the United States with a correlation coefficient (R) of 0.273 and weighted average of 14.7%, a difference of 3.5%.
Immigrants from Israel vs Tlingit-Haida Child Poverty Among Girls Under 16

Child Poverty Among Girls Under 16 Correlation Summary

MeasurementImmigrants from IsraelTlingit-Haida
Minimum0.66%0.43%
Maximum60.7%50.0%
Range60.0%49.6%
Mean13.5%16.8%
Median10.9%15.6%
Interquartile 25% (IQ1)6.0%7.0%
Interquartile 75% (IQ3)16.9%25.7%
Interquartile Range (IQR)10.8%18.7%
Standard Deviation (Sample)12.0%12.0%
Standard Deviation (Population)11.9%11.8%

Similar Demographics by Child Poverty Among Girls Under 16

Demographics Similar to Immigrants from Israel by Child Poverty Among Girls Under 16

In terms of child poverty among girls under 16, the demographic groups most similar to Immigrants from Israel are Greek (14.2%, a difference of 0.070%), Czech (14.2%, a difference of 0.11%), Immigrants from Czechoslovakia (14.2%, a difference of 0.12%), Croatian (14.1%, a difference of 0.15%), and Immigrants from Greece (14.1%, a difference of 0.18%).
DemographicsRating | RankChild Poverty Among Girls Under 16
Koreans
99.4
/100
|
#43
Exceptional
14.1%
Immigrants | Asia
99.4
/100
|
#44
Exceptional
14.1%
Immigrants | Greece
99.3
/100
|
#45
Exceptional
14.1%
Croatians
99.3
/100
|
#46
Exceptional
14.1%
Immigrants | Czechoslovakia
99.3
/100
|
#47
Exceptional
14.2%
Czechs
99.3
/100
|
#48
Exceptional
14.2%
Greeks
99.2
/100
|
#49
Exceptional
14.2%
Immigrants | Israel
99.2
/100
|
#50
Exceptional
14.2%
Immigrants | Pakistan
99.1
/100
|
#51
Exceptional
14.2%
Italians
99.1
/100
|
#52
Exceptional
14.3%
Luxembourgers
99.0
/100
|
#53
Exceptional
14.3%
Estonians
98.9
/100
|
#54
Exceptional
14.3%
Immigrants | Romania
98.9
/100
|
#55
Exceptional
14.3%
Immigrants | Indonesia
98.9
/100
|
#56
Exceptional
14.4%
Immigrants | Serbia
98.9
/100
|
#57
Exceptional
14.4%

Demographics Similar to Tlingit-Haida by Child Poverty Among Girls Under 16

In terms of child poverty among girls under 16, the demographic groups most similar to Tlingit-Haida are Immigrants from Russia (14.7%, a difference of 0.010%), Argentinean (14.7%, a difference of 0.010%), Immigrants from Turkey (14.7%, a difference of 0.020%), Egyptian (14.7%, a difference of 0.030%), and Immigrants from Eastern Europe (14.6%, a difference of 0.16%).
DemographicsRating | RankChild Poverty Among Girls Under 16
Europeans
98.1
/100
|
#70
Exceptional
14.6%
Slovenes
98.1
/100
|
#71
Exceptional
14.6%
Immigrants | Netherlands
98.1
/100
|
#72
Exceptional
14.6%
Immigrants | Austria
98.0
/100
|
#73
Exceptional
14.6%
Taiwanese
98.0
/100
|
#74
Exceptional
14.6%
Immigrants | Eastern Europe
98.0
/100
|
#75
Exceptional
14.6%
Immigrants | Russia
97.9
/100
|
#76
Exceptional
14.7%
Tlingit-Haida
97.9
/100
|
#77
Exceptional
14.7%
Argentineans
97.9
/100
|
#78
Exceptional
14.7%
Immigrants | Turkey
97.9
/100
|
#79
Exceptional
14.7%
Egyptians
97.9
/100
|
#80
Exceptional
14.7%
Ukrainians
97.7
/100
|
#81
Exceptional
14.7%
Macedonians
97.6
/100
|
#82
Exceptional
14.7%
Immigrants | Italy
97.4
/100
|
#83
Exceptional
14.8%
Soviet Union
97.3
/100
|
#84
Exceptional
14.8%