Immigrants from Hungary vs Celtic Single Male Poverty

COMPARE

Immigrants from Hungary
Race
Ancestry
AfghanAfricanAlaska NativeAlaskan AthabascanAlbanianAleutAlsatianAmericanApacheArabArapahoArgentineanArmenianAssyrian/Chaldean/SyriacAustralianAustrianBahamianBangladeshiBarbadianBasqueBelgianBelizeanBermudanBhutaneseBlackfeetBolivianBrazilianBritishBritish West IndianBulgarianBurmeseCajunCambodianCanadianCape VerdeanCarpatho RusynCentral AmericanCentral American IndianCherokeeCheyenneChickasawChileanChineseChippewaChoctawColombianColvilleComancheCosta RicanCreeCreekCroatianCrowCubanCypriotCzechCzechoslovakianDanishDelawareDominicanDutchDutch West IndianEastern EuropeanEcuadorianEgyptianEnglishEstonianEthiopianEuropeanFijianFilipinoFinnishFrenchFrench American IndianFrench CanadianGermanGerman RussianGhanaianGreekGuamanian/ChamorroGuatemalanGuyaneseHaitianHmongHonduranHopiHoumaHungarianIcelanderIndian (Asian)IndonesianInupiatIranianIraqiIrishIroquoisIsraeliItalianJamaicanJapaneseJordanianKenyanKiowaKoreanLaotianLatvianLebaneseLiberianLithuanianLumbeeLuxembourgerMacedonianMalaysianMalteseMarshalleseMenomineeMexicanMexican American IndianMongolianMoroccanNative HawaiianNavajoNepaleseNew ZealanderNicaraguanNigerianNorthern EuropeanNorwegianOkinawanOsageOttawaPaiutePakistaniPalestinianPanamanianParaguayanPennsylvania GermanPeruvianPimaPolishPortuguesePotawatomiPuebloPuerto RicanPuget Sound SalishRomanianRussianSalvadoranSamoanScandinavianScotch-IrishScottishSeminoleSenegaleseSerbianShoshoneSierra LeoneanSiouxSlavicSlovakSloveneSomaliSouth AfricanSouth AmericanSouth American IndianSoviet UnionSpaniardSpanishSpanish AmericanSpanish American IndianSri LankanSubsaharan AfricanSudaneseSwedishSwissSyrianTaiwaneseThaiTlingit-HaidaTohono O'OdhamTonganTrinidadian and TobagonianTsimshianTurkishU.S. Virgin IslanderUgandanUkrainianUruguayanUteVenezuelanVietnameseWelshWest IndianYakamaYaquiYugoslavianYumanYup'ikZimbabwean
Immigration
NonimmigrantsImmigrantsAfghanistanAfricaAlbaniaArgentinaArmeniaAsiaAustraliaAustriaBahamasBangladeshBarbadosBelarusBelgiumBelizeBoliviaBosnia and HerzegovinaBrazilBulgariaBurma/MyanmarCabo VerdeCambodiaCameroonCanadaCaribbeanCentral AmericaChileChinaColombiaCongoCosta RicaCroatiaCubaCzechoslovakiaDenmarkDominicaDominican RepublicEastern AfricaEastern AsiaEastern EuropeEcuadorEgyptEl SalvadorEnglandEritreaEthiopiaEuropeFijiFranceGermanyGhanaGreeceGrenadaGuatemalaGuyanaHaitiHondurasHong KongHungaryIndiaIndonesiaIranIraqIrelandIsraelItalyJamaicaJapanJordanKazakhstanKenyaKoreaKuwaitLaosLatin AmericaLatviaLebanonLiberiaLithuaniaMalaysiaMexicoMicronesiaMiddle AfricaMoldovaMoroccoNepalNetherlandsNicaraguaNigeriaNorth AmericaNorth MacedoniaNorthern AfricaNorthern EuropeNorwayOceaniaPakistanPanamaPeruPhilippinesPolandPortugalRomaniaRussiaSaudi ArabiaScotlandSenegalSerbiaSierra LeoneSingaporeSomaliaSouth AfricaSouth AmericaSouth Central AsiaSouth Eastern AsiaSouthern EuropeSpainSri LankaSt. Vincent and the GrenadinesSudanSwedenSwitzerlandSyriaTaiwanThailandTrinidad and TobagoTurkeyUgandaUkraineUruguayUzbekistanVenezuelaVietnamWest IndiesWestern AfricaWestern AsiaWestern EuropeYemenZaireZimbabweAzores
Celtic
Race
Ancestry
AfghanAfricanAlaska NativeAlaskan AthabascanAlbanianAleutAlsatianAmericanApacheArabArapahoArgentineanArmenianAssyrian/Chaldean/SyriacAustralianAustrianBahamianBangladeshiBarbadianBasqueBelgianBelizeanBermudanBhutaneseBlackfeetBolivianBrazilianBritishBritish West IndianBulgarianBurmeseCajunCambodianCanadianCape VerdeanCarpatho RusynCelticCentral AmericanCentral American IndianCherokeeCheyenneChickasawChileanChineseChippewaChoctawColombianColvilleComancheCosta RicanCreeCreekCroatianCrowCubanCypriotCzechCzechoslovakianDanishDelawareDominicanDutchDutch West IndianEastern EuropeanEcuadorianEgyptianEnglishEstonianEthiopianEuropeanFijianFilipinoFinnishFrenchFrench American IndianFrench CanadianGermanGerman RussianGhanaianGreekGuamanian/ChamorroGuatemalanGuyaneseHaitianHmongHonduranHopiHoumaHungarianIcelanderIndian (Asian)IndonesianInupiatIranianIraqiIrishIroquoisIsraeliItalianJamaicanJapaneseJordanianKenyanKiowaKoreanLaotianLatvianLebaneseLiberianLithuanianLumbeeLuxembourgerMacedonianMalaysianMalteseMarshalleseMenomineeMexicanMexican American IndianMongolianMoroccanNative HawaiianNavajoNepaleseNew ZealanderNicaraguanNigerianNorthern EuropeanNorwegianOkinawanOsageOttawaPaiutePakistaniPalestinianPanamanianParaguayanPennsylvania GermanPeruvianPimaPolishPortuguesePotawatomiPuebloPuerto RicanPuget Sound SalishRomanianRussianSalvadoranSamoanScandinavianScotch-IrishScottishSeminoleSenegaleseSerbianShoshoneSierra LeoneanSiouxSlavicSlovakSloveneSomaliSouth AfricanSouth AmericanSouth American IndianSoviet UnionSpaniardSpanishSpanish AmericanSpanish American IndianSri LankanSubsaharan AfricanSudaneseSwedishSwissSyrianTaiwaneseThaiTlingit-HaidaTohono O'OdhamTonganTrinidadian and TobagonianTsimshianTurkishU.S. Virgin IslanderUgandanUkrainianUruguayanUteVenezuelanVietnameseWelshWest IndianYakamaYaquiYugoslavianYumanYup'ikZimbabwean
Immigration
NonimmigrantsImmigrantsAfghanistanAfricaAlbaniaArgentinaArmeniaAsiaAustraliaAustriaBahamasBangladeshBarbadosBelarusBelgiumBelizeBoliviaBosnia and HerzegovinaBrazilBulgariaBurma/MyanmarCabo VerdeCambodiaCameroonCanadaCaribbeanCentral AmericaChileChinaColombiaCongoCosta RicaCroatiaCubaCzechoslovakiaDenmarkDominicaDominican RepublicEastern AfricaEastern AsiaEastern EuropeEcuadorEgyptEl SalvadorEnglandEritreaEthiopiaEuropeFijiFranceGermanyGhanaGreeceGrenadaGuatemalaGuyanaHaitiHondurasHong KongIndiaIndonesiaIranIraqIrelandIsraelItalyJamaicaJapanJordanKazakhstanKenyaKoreaKuwaitLaosLatin AmericaLatviaLebanonLiberiaLithuaniaMalaysiaMexicoMicronesiaMiddle AfricaMoldovaMoroccoNepalNetherlandsNicaraguaNigeriaNorth AmericaNorth MacedoniaNorthern AfricaNorthern EuropeNorwayOceaniaPakistanPanamaPeruPhilippinesPolandPortugalRomaniaRussiaSaudi ArabiaScotlandSenegalSerbiaSierra LeoneSingaporeSomaliaSouth AfricaSouth AmericaSouth Central AsiaSouth Eastern AsiaSouthern EuropeSpainSri LankaSt. Vincent and the GrenadinesSudanSwedenSwitzerlandSyriaTaiwanThailandTrinidad and TobagoTurkeyUgandaUkraineUruguayUzbekistanVenezuelaVietnamWest IndiesWestern AfricaWestern AsiaWestern EuropeYemenZaireZimbabweAzores
Single Male Poverty
Income
Poverty
Unemployment
Labor Participation
Family Structure
Vehicle Availability
Education Level
Disability

Single Male Poverty Comparison

Immigrants from Hungary

Celtics

Good
Tragic
12.6%
SINGLE MALE POVERTY
71.9/ 100
METRIC RATING
151st/ 347
METRIC RANK
14.5%
SINGLE MALE POVERTY
0.0/ 100
METRIC RATING
286th/ 347
METRIC RANK

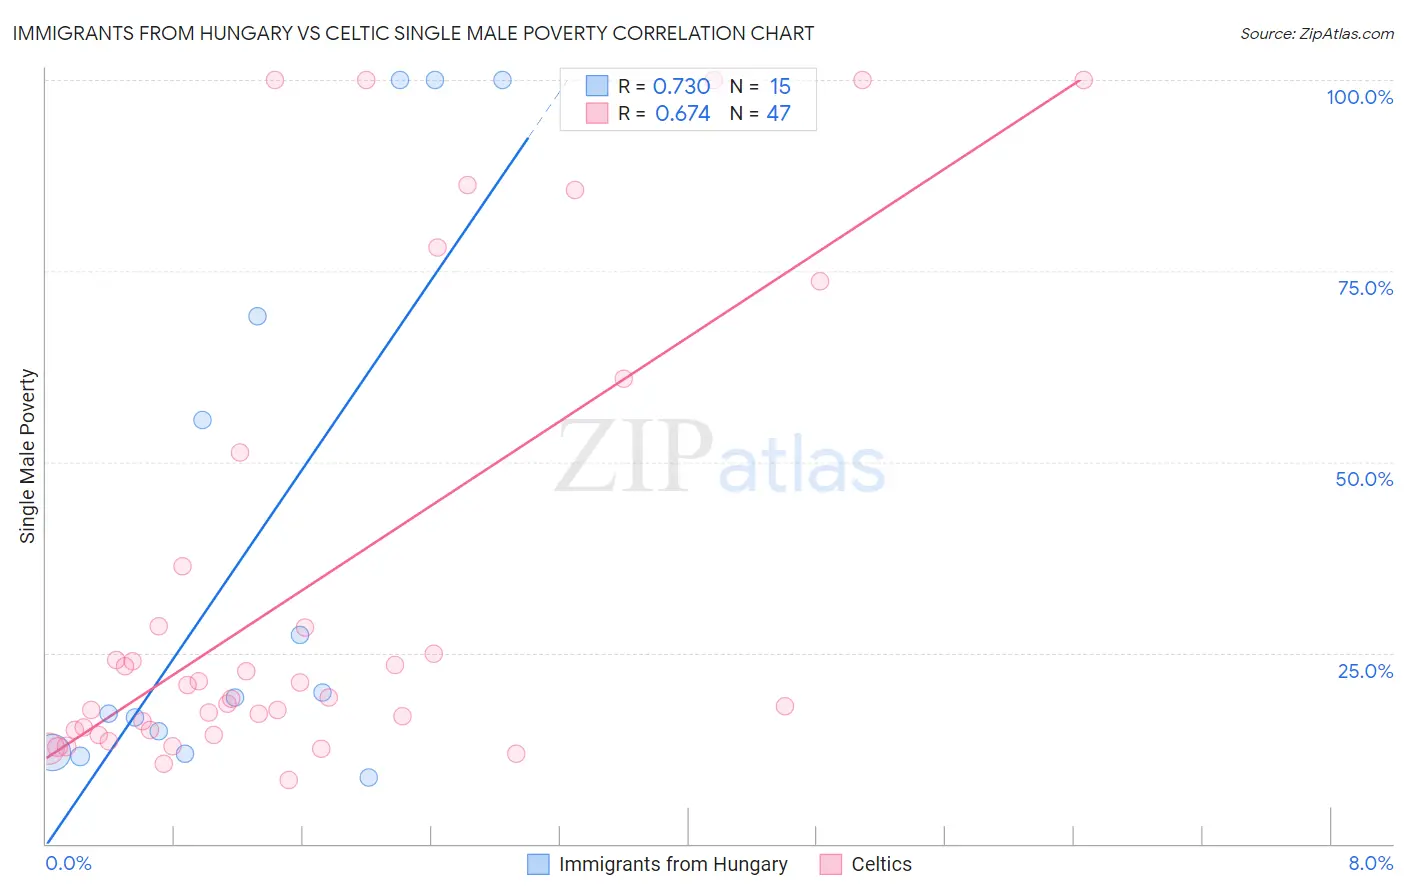
Immigrants from Hungary vs Celtic Single Male Poverty Correlation Chart

The statistical analysis conducted on geographies consisting of 178,525,850 people shows a strong positive correlation between the proportion of Immigrants from Hungary and poverty level among single males in the United States with a correlation coefficient (R) of 0.730 and weighted average of 12.6%. Similarly, the statistical analysis conducted on geographies consisting of 157,117,336 people shows a significant positive correlation between the proportion of Celtics and poverty level among single males in the United States with a correlation coefficient (R) of 0.674 and weighted average of 14.5%, a difference of 14.5%.
Immigrants from Hungary vs Celtic Single Male Poverty

Single Male Poverty Correlation Summary

MeasurementImmigrants from HungaryCeltic
Minimum8.7%8.3%
Maximum100.0%100.0%
Range91.3%91.7%
Mean38.9%33.9%
Median19.1%19.2%
Interquartile 25% (IQ1)11.9%14.9%
Interquartile 75% (IQ3)69.1%36.4%
Interquartile Range (IQR)57.2%21.5%
Standard Deviation (Sample)35.8%30.2%
Standard Deviation (Population)34.6%29.8%

Similar Demographics by Single Male Poverty

Demographics Similar to Immigrants from Hungary by Single Male Poverty

In terms of single male poverty, the demographic groups most similar to Immigrants from Hungary are Immigrants from Panama (12.6%, a difference of 0.010%), Australian (12.6%, a difference of 0.030%), Sierra Leonean (12.6%, a difference of 0.070%), Immigrants (12.7%, a difference of 0.12%), and Yugoslavian (12.6%, a difference of 0.14%).
DemographicsRating | RankSingle Male Poverty
Hawaiians
75.1
/100
|
#144
Good
12.6%
Immigrants | Lebanon
75.0
/100
|
#145
Good
12.6%
Native Hawaiians
75.0
/100
|
#146
Good
12.6%
Malaysians
74.8
/100
|
#147
Good
12.6%
Yugoslavians
73.9
/100
|
#148
Good
12.6%
Sierra Leoneans
73.0
/100
|
#149
Good
12.6%
Immigrants | Panama
72.1
/100
|
#150
Good
12.6%
Immigrants | Hungary
71.9
/100
|
#151
Good
12.6%
Australians
71.4
/100
|
#152
Good
12.6%
Immigrants | Immigrants
70.1
/100
|
#153
Good
12.7%
Immigrants | Scotland
68.9
/100
|
#154
Good
12.7%
Immigrants | Spain
68.7
/100
|
#155
Good
12.7%
Vietnamese
67.9
/100
|
#156
Good
12.7%
Latvians
67.9
/100
|
#157
Good
12.7%
Immigrants | Middle Africa
64.9
/100
|
#158
Good
12.7%

Demographics Similar to Celtics by Single Male Poverty

In terms of single male poverty, the demographic groups most similar to Celtics are Iroquois (14.5%, a difference of 0.13%), White/Caucasian (14.5%, a difference of 0.13%), Immigrants from Dominica (14.5%, a difference of 0.22%), French (14.4%, a difference of 0.32%), and U.S. Virgin Islander (14.5%, a difference of 0.44%).
DemographicsRating | RankSingle Male Poverty
Indonesians
0.0
/100
|
#279
Tragic
14.1%
Hmong
0.0
/100
|
#280
Tragic
14.2%
Hispanics or Latinos
0.0
/100
|
#281
Tragic
14.2%
Spanish Americans
0.0
/100
|
#282
Tragic
14.2%
Yaqui
0.0
/100
|
#283
Tragic
14.2%
Immigrants | Bahamas
0.0
/100
|
#284
Tragic
14.4%
French
0.0
/100
|
#285
Tragic
14.4%
Celtics
0.0
/100
|
#286
Tragic
14.5%
Iroquois
0.0
/100
|
#287
Tragic
14.5%
Whites/Caucasians
0.0
/100
|
#288
Tragic
14.5%
Immigrants | Dominica
0.0
/100
|
#289
Tragic
14.5%
U.S. Virgin Islanders
0.0
/100
|
#290
Tragic
14.5%
Bahamians
0.0
/100
|
#291
Tragic
14.6%
Immigrants | Nonimmigrants
0.0
/100
|
#292
Tragic
14.6%
French Canadians
0.0
/100
|
#293
Tragic
14.6%