Immigrants from Hungary vs Celtic No Schooling Completed

COMPARE

Immigrants from Hungary
Race
Ancestry
AfghanAfricanAlaska NativeAlaskan AthabascanAlbanianAleutAlsatianAmericanApacheArabArapahoArgentineanArmenianAssyrian/Chaldean/SyriacAustralianAustrianBahamianBangladeshiBarbadianBasqueBelgianBelizeanBermudanBhutaneseBlackfeetBolivianBrazilianBritishBritish West IndianBulgarianBurmeseCajunCambodianCanadianCape VerdeanCarpatho RusynCentral AmericanCentral American IndianCherokeeCheyenneChickasawChileanChineseChippewaChoctawColombianColvilleComancheCosta RicanCreeCreekCroatianCrowCubanCypriotCzechCzechoslovakianDanishDelawareDominicanDutchDutch West IndianEastern EuropeanEcuadorianEgyptianEnglishEstonianEthiopianEuropeanFijianFilipinoFinnishFrenchFrench American IndianFrench CanadianGermanGerman RussianGhanaianGreekGuamanian/ChamorroGuatemalanGuyaneseHaitianHmongHonduranHopiHoumaHungarianIcelanderIndian (Asian)IndonesianInupiatIranianIraqiIrishIroquoisIsraeliItalianJamaicanJapaneseJordanianKenyanKiowaKoreanLaotianLatvianLebaneseLiberianLithuanianLumbeeLuxembourgerMacedonianMalaysianMalteseMarshalleseMenomineeMexicanMexican American IndianMongolianMoroccanNative HawaiianNavajoNepaleseNew ZealanderNicaraguanNigerianNorthern EuropeanNorwegianOkinawanOsageOttawaPaiutePakistaniPalestinianPanamanianParaguayanPennsylvania GermanPeruvianPimaPolishPortuguesePotawatomiPuebloPuerto RicanPuget Sound SalishRomanianRussianSalvadoranSamoanScandinavianScotch-IrishScottishSeminoleSenegaleseSerbianShoshoneSierra LeoneanSiouxSlavicSlovakSloveneSomaliSouth AfricanSouth AmericanSouth American IndianSoviet UnionSpaniardSpanishSpanish AmericanSpanish American IndianSri LankanSubsaharan AfricanSudaneseSwedishSwissSyrianTaiwaneseThaiTlingit-HaidaTohono O'OdhamTonganTrinidadian and TobagonianTsimshianTurkishU.S. Virgin IslanderUgandanUkrainianUruguayanUteVenezuelanVietnameseWelshWest IndianYakamaYaquiYugoslavianYumanYup'ikZimbabwean
Immigration
NonimmigrantsImmigrantsAfghanistanAfricaAlbaniaArgentinaArmeniaAsiaAustraliaAustriaBahamasBangladeshBarbadosBelarusBelgiumBelizeBoliviaBosnia and HerzegovinaBrazilBulgariaBurma/MyanmarCabo VerdeCambodiaCameroonCanadaCaribbeanCentral AmericaChileChinaColombiaCongoCosta RicaCroatiaCubaCzechoslovakiaDenmarkDominicaDominican RepublicEastern AfricaEastern AsiaEastern EuropeEcuadorEgyptEl SalvadorEnglandEritreaEthiopiaEuropeFijiFranceGermanyGhanaGreeceGrenadaGuatemalaGuyanaHaitiHondurasHong KongHungaryIndiaIndonesiaIranIraqIrelandIsraelItalyJamaicaJapanJordanKazakhstanKenyaKoreaKuwaitLaosLatin AmericaLatviaLebanonLiberiaLithuaniaMalaysiaMexicoMicronesiaMiddle AfricaMoldovaMoroccoNepalNetherlandsNicaraguaNigeriaNorth AmericaNorth MacedoniaNorthern AfricaNorthern EuropeNorwayOceaniaPakistanPanamaPeruPhilippinesPolandPortugalRomaniaRussiaSaudi ArabiaScotlandSenegalSerbiaSierra LeoneSingaporeSomaliaSouth AfricaSouth AmericaSouth Central AsiaSouth Eastern AsiaSouthern EuropeSpainSri LankaSt. Vincent and the GrenadinesSudanSwedenSwitzerlandSyriaTaiwanThailandTrinidad and TobagoTurkeyUgandaUkraineUruguayUzbekistanVenezuelaVietnamWest IndiesWestern AfricaWestern AsiaWestern EuropeYemenZaireZimbabweAzores
Celtic
Race
Ancestry
AfghanAfricanAlaska NativeAlaskan AthabascanAlbanianAleutAlsatianAmericanApacheArabArapahoArgentineanArmenianAssyrian/Chaldean/SyriacAustralianAustrianBahamianBangladeshiBarbadianBasqueBelgianBelizeanBermudanBhutaneseBlackfeetBolivianBrazilianBritishBritish West IndianBulgarianBurmeseCajunCambodianCanadianCape VerdeanCarpatho RusynCelticCentral AmericanCentral American IndianCherokeeCheyenneChickasawChileanChineseChippewaChoctawColombianColvilleComancheCosta RicanCreeCreekCroatianCrowCubanCypriotCzechCzechoslovakianDanishDelawareDominicanDutchDutch West IndianEastern EuropeanEcuadorianEgyptianEnglishEstonianEthiopianEuropeanFijianFilipinoFinnishFrenchFrench American IndianFrench CanadianGermanGerman RussianGhanaianGreekGuamanian/ChamorroGuatemalanGuyaneseHaitianHmongHonduranHopiHoumaHungarianIcelanderIndian (Asian)IndonesianInupiatIranianIraqiIrishIroquoisIsraeliItalianJamaicanJapaneseJordanianKenyanKiowaKoreanLaotianLatvianLebaneseLiberianLithuanianLumbeeLuxembourgerMacedonianMalaysianMalteseMarshalleseMenomineeMexicanMexican American IndianMongolianMoroccanNative HawaiianNavajoNepaleseNew ZealanderNicaraguanNigerianNorthern EuropeanNorwegianOkinawanOsageOttawaPaiutePakistaniPalestinianPanamanianParaguayanPennsylvania GermanPeruvianPimaPolishPortuguesePotawatomiPuebloPuerto RicanPuget Sound SalishRomanianRussianSalvadoranSamoanScandinavianScotch-IrishScottishSeminoleSenegaleseSerbianShoshoneSierra LeoneanSiouxSlavicSlovakSloveneSomaliSouth AfricanSouth AmericanSouth American IndianSoviet UnionSpaniardSpanishSpanish AmericanSpanish American IndianSri LankanSubsaharan AfricanSudaneseSwedishSwissSyrianTaiwaneseThaiTlingit-HaidaTohono O'OdhamTonganTrinidadian and TobagonianTsimshianTurkishU.S. Virgin IslanderUgandanUkrainianUruguayanUteVenezuelanVietnameseWelshWest IndianYakamaYaquiYugoslavianYumanYup'ikZimbabwean
Immigration
NonimmigrantsImmigrantsAfghanistanAfricaAlbaniaArgentinaArmeniaAsiaAustraliaAustriaBahamasBangladeshBarbadosBelarusBelgiumBelizeBoliviaBosnia and HerzegovinaBrazilBulgariaBurma/MyanmarCabo VerdeCambodiaCameroonCanadaCaribbeanCentral AmericaChileChinaColombiaCongoCosta RicaCroatiaCubaCzechoslovakiaDenmarkDominicaDominican RepublicEastern AfricaEastern AsiaEastern EuropeEcuadorEgyptEl SalvadorEnglandEritreaEthiopiaEuropeFijiFranceGermanyGhanaGreeceGrenadaGuatemalaGuyanaHaitiHondurasHong KongIndiaIndonesiaIranIraqIrelandIsraelItalyJamaicaJapanJordanKazakhstanKenyaKoreaKuwaitLaosLatin AmericaLatviaLebanonLiberiaLithuaniaMalaysiaMexicoMicronesiaMiddle AfricaMoldovaMoroccoNepalNetherlandsNicaraguaNigeriaNorth AmericaNorth MacedoniaNorthern AfricaNorthern EuropeNorwayOceaniaPakistanPanamaPeruPhilippinesPolandPortugalRomaniaRussiaSaudi ArabiaScotlandSenegalSerbiaSierra LeoneSingaporeSomaliaSouth AfricaSouth AmericaSouth Central AsiaSouth Eastern AsiaSouthern EuropeSpainSri LankaSt. Vincent and the GrenadinesSudanSwedenSwitzerlandSyriaTaiwanThailandTrinidad and TobagoTurkeyUgandaUkraineUruguayUzbekistanVenezuelaVietnamWest IndiesWestern AfricaWestern AsiaWestern EuropeYemenZaireZimbabweAzores
No Schooling Completed
Income
Poverty
Unemployment
Labor Participation
Family Structure
Vehicle Availability
Education Level
Disability

No Schooling Completed Comparison

Immigrants from Hungary

Celtics

Exceptional
Exceptional
1.9%
NO SCHOOLING COMPLETED
91.6/ 100
METRIC RATING
131st/ 347
METRIC RANK
1.6%
NO SCHOOLING COMPLETED
99.9/ 100
METRIC RATING
50th/ 347
METRIC RANK

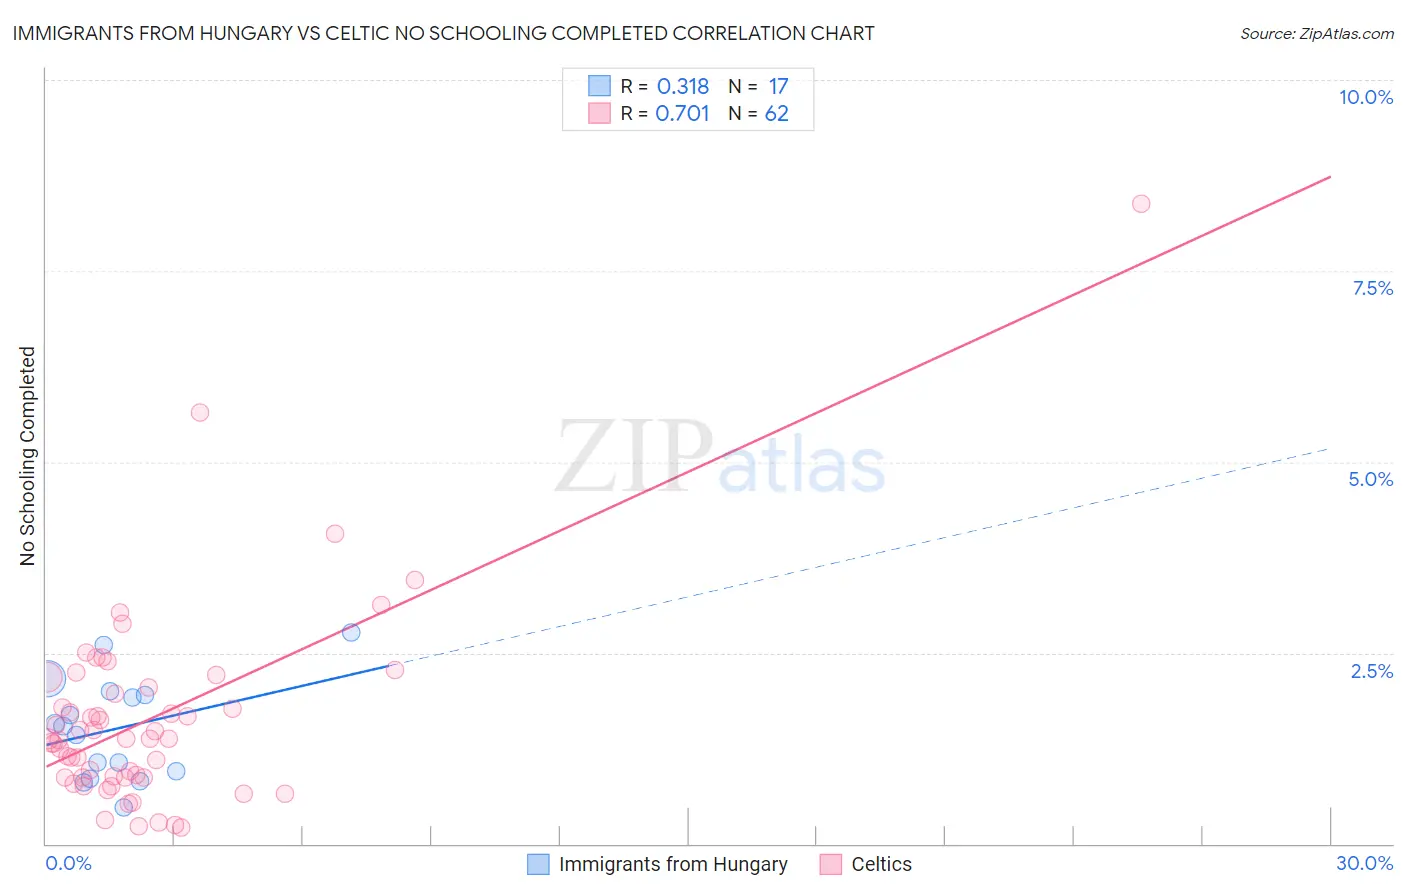
Immigrants from Hungary vs Celtic No Schooling Completed Correlation Chart

The statistical analysis conducted on geographies consisting of 194,617,167 people shows a mild positive correlation between the proportion of Immigrants from Hungary and percentage of population with no schooling in the United States with a correlation coefficient (R) of 0.318 and weighted average of 1.9%. Similarly, the statistical analysis conducted on geographies consisting of 167,819,688 people shows a strong positive correlation between the proportion of Celtics and percentage of population with no schooling in the United States with a correlation coefficient (R) of 0.701 and weighted average of 1.6%, a difference of 17.8%.
Immigrants from Hungary vs Celtic No Schooling Completed

No Schooling Completed Correlation Summary

MeasurementImmigrants from HungaryCeltic
Minimum0.47%0.22%
Maximum2.8%8.4%
Range2.3%8.2%
Mean1.5%1.6%
Median1.5%1.4%
Interquartile 25% (IQ1)0.91%0.87%
Interquartile 75% (IQ3)2.0%2.0%
Interquartile Range (IQR)1.1%1.2%
Standard Deviation (Sample)0.66%1.3%
Standard Deviation (Population)0.64%1.3%

Similar Demographics by No Schooling Completed

Demographics Similar to Immigrants from Hungary by No Schooling Completed

In terms of no schooling completed, the demographic groups most similar to Immigrants from Hungary are Palestinian (1.9%, a difference of 0.11%), Seminole (1.9%, a difference of 0.21%), Spaniard (1.9%, a difference of 0.35%), Israeli (1.9%, a difference of 0.44%), and Colville (1.9%, a difference of 0.50%).
DemographicsRating | RankNo Schooling Completed
Cambodians
93.8
/100
|
#124
Exceptional
1.9%
Immigrants | Europe
93.7
/100
|
#125
Exceptional
1.9%
Immigrants | Romania
92.6
/100
|
#126
Exceptional
1.9%
Israelis
92.4
/100
|
#127
Exceptional
1.9%
Spaniards
92.3
/100
|
#128
Exceptional
1.9%
Seminole
92.0
/100
|
#129
Exceptional
1.9%
Palestinians
91.8
/100
|
#130
Exceptional
1.9%
Immigrants | Hungary
91.6
/100
|
#131
Exceptional
1.9%
Colville
90.4
/100
|
#132
Exceptional
1.9%
Immigrants | Turkey
90.2
/100
|
#133
Exceptional
1.9%
Menominee
89.6
/100
|
#134
Excellent
1.9%
Hmong
88.5
/100
|
#135
Excellent
1.9%
Burmese
88.2
/100
|
#136
Excellent
1.9%
Filipinos
85.5
/100
|
#137
Excellent
2.0%
Immigrants | Israel
85.4
/100
|
#138
Excellent
2.0%

Demographics Similar to Celtics by No Schooling Completed

In terms of no schooling completed, the demographic groups most similar to Celtics are White/Caucasian (1.6%, a difference of 0.13%), Immigrants from Scotland (1.6%, a difference of 0.19%), Chippewa (1.6%, a difference of 0.20%), Immigrants from Canada (1.6%, a difference of 0.27%), and Creek (1.6%, a difference of 0.40%).
DemographicsRating | RankNo Schooling Completed
Australians
99.9
/100
|
#43
Exceptional
1.6%
Estonians
99.9
/100
|
#44
Exceptional
1.6%
Czechoslovakians
99.9
/100
|
#45
Exceptional
1.6%
Maltese
99.9
/100
|
#46
Exceptional
1.6%
Ottawa
99.9
/100
|
#47
Exceptional
1.6%
Immigrants | Scotland
99.9
/100
|
#48
Exceptional
1.6%
Whites/Caucasians
99.9
/100
|
#49
Exceptional
1.6%
Celtics
99.9
/100
|
#50
Exceptional
1.6%
Chippewa
99.8
/100
|
#51
Exceptional
1.6%
Immigrants | Canada
99.8
/100
|
#52
Exceptional
1.6%
Creek
99.8
/100
|
#53
Exceptional
1.6%
Crow
99.8
/100
|
#54
Exceptional
1.6%
Greeks
99.8
/100
|
#55
Exceptional
1.6%
Immigrants | North America
99.8
/100
|
#56
Exceptional
1.6%
Austrians
99.8
/100
|
#57
Exceptional
1.6%