Immigrants from Germany vs Guatemalan Child Poverty Among Girls Under 16

COMPARE

Immigrants from Germany
Race
Ancestry
AfghanAfricanAlaska NativeAlaskan AthabascanAlbanianAleutAlsatianAmericanApacheArabArapahoArgentineanArmenianAssyrian/Chaldean/SyriacAustralianAustrianBahamianBangladeshiBarbadianBasqueBelgianBelizeanBermudanBhutaneseBlackfeetBolivianBrazilianBritishBritish West IndianBulgarianBurmeseCajunCambodianCanadianCape VerdeanCarpatho RusynCelticCentral AmericanCentral American IndianCherokeeCheyenneChickasawChileanChineseChippewaChoctawColombianColvilleComancheCosta RicanCreeCreekCroatianCrowCubanCypriotCzechCzechoslovakianDanishDelawareDominicanDutchDutch West IndianEastern EuropeanEcuadorianEgyptianEnglishEstonianEthiopianEuropeanFijianFilipinoFinnishFrenchFrench American IndianFrench CanadianGermanGerman RussianGhanaianGreekGuamanian/ChamorroGuyaneseHaitianHmongHonduranHopiHoumaHungarianIcelanderIndian (Asian)IndonesianInupiatIranianIraqiIrishIroquoisIsraeliItalianJamaicanJapaneseJordanianKenyanKiowaKoreanLaotianLatvianLebaneseLiberianLithuanianLumbeeLuxembourgerMacedonianMalaysianMalteseMarshalleseMenomineeMexicanMexican American IndianMongolianMoroccanNative HawaiianNavajoNepaleseNew ZealanderNicaraguanNigerianNorthern EuropeanNorwegianOkinawanOsageOttawaPaiutePakistaniPalestinianPanamanianParaguayanPennsylvania GermanPeruvianPimaPolishPortuguesePotawatomiPuebloPuerto RicanPuget Sound SalishRomanianRussianSalvadoranSamoanScandinavianScotch-IrishScottishSeminoleSenegaleseSerbianShoshoneSierra LeoneanSiouxSlavicSlovakSloveneSomaliSouth AfricanSouth AmericanSouth American IndianSoviet UnionSpaniardSpanishSpanish AmericanSpanish American IndianSri LankanSubsaharan AfricanSudaneseSwedishSwissSyrianTaiwaneseThaiTlingit-HaidaTohono O'OdhamTonganTrinidadian and TobagonianTsimshianTurkishU.S. Virgin IslanderUgandanUkrainianUruguayanUteVenezuelanVietnameseWelshWest IndianYakamaYaquiYugoslavianYumanYup'ikZimbabwean
Immigration
NonimmigrantsImmigrantsAfghanistanAfricaAlbaniaArgentinaArmeniaAsiaAustraliaAustriaBahamasBangladeshBarbadosBelarusBelgiumBelizeBoliviaBosnia and HerzegovinaBrazilBulgariaBurma/MyanmarCabo VerdeCambodiaCameroonCanadaCaribbeanCentral AmericaChileChinaColombiaCongoCosta RicaCroatiaCubaCzechoslovakiaDenmarkDominicaDominican RepublicEastern AfricaEastern AsiaEastern EuropeEcuadorEgyptEl SalvadorEnglandEritreaEthiopiaEuropeFijiFranceGermanyGhanaGreeceGrenadaGuatemalaGuyanaHaitiHondurasHong KongHungaryIndiaIndonesiaIranIraqIrelandIsraelItalyJamaicaJapanJordanKazakhstanKenyaKoreaKuwaitLaosLatin AmericaLatviaLebanonLiberiaLithuaniaMalaysiaMexicoMicronesiaMiddle AfricaMoldovaMoroccoNepalNetherlandsNicaraguaNigeriaNorth AmericaNorth MacedoniaNorthern AfricaNorthern EuropeNorwayOceaniaPakistanPanamaPeruPhilippinesPolandPortugalRomaniaRussiaSaudi ArabiaScotlandSenegalSerbiaSierra LeoneSingaporeSomaliaSouth AfricaSouth AmericaSouth Central AsiaSouth Eastern AsiaSouthern EuropeSpainSri LankaSt. Vincent and the GrenadinesSudanSwedenSwitzerlandSyriaTaiwanThailandTrinidad and TobagoTurkeyUgandaUkraineUruguayUzbekistanVenezuelaVietnamWest IndiesWestern AfricaWestern AsiaWestern EuropeYemenZaireZimbabweAzores
Guatemalan
Race
Ancestry
AfghanAfricanAlaska NativeAlaskan AthabascanAlbanianAleutAlsatianAmericanApacheArabArapahoArgentineanArmenianAssyrian/Chaldean/SyriacAustralianAustrianBahamianBangladeshiBarbadianBasqueBelgianBelizeanBermudanBhutaneseBlackfeetBolivianBrazilianBritishBritish West IndianBulgarianBurmeseCajunCambodianCanadianCape VerdeanCarpatho RusynCelticCentral AmericanCentral American IndianCherokeeCheyenneChickasawChileanChineseChippewaChoctawColombianColvilleComancheCosta RicanCreeCreekCroatianCrowCubanCypriotCzechCzechoslovakianDanishDelawareDominicanDutchDutch West IndianEastern EuropeanEcuadorianEgyptianEnglishEstonianEthiopianEuropeanFijianFilipinoFinnishFrenchFrench American IndianFrench CanadianGermanGerman RussianGhanaianGreekGuamanian/ChamorroGuatemalanGuyaneseHaitianHmongHonduranHopiHoumaHungarianIcelanderIndian (Asian)IndonesianInupiatIranianIraqiIrishIroquoisIsraeliItalianJamaicanJapaneseJordanianKenyanKiowaKoreanLaotianLatvianLebaneseLiberianLithuanianLumbeeLuxembourgerMacedonianMalaysianMalteseMarshalleseMenomineeMexicanMexican American IndianMongolianMoroccanNative HawaiianNavajoNepaleseNew ZealanderNicaraguanNigerianNorthern EuropeanNorwegianOkinawanOsageOttawaPaiutePakistaniPalestinianPanamanianParaguayanPennsylvania GermanPeruvianPimaPolishPortuguesePotawatomiPuebloPuerto RicanPuget Sound SalishRomanianRussianSalvadoranSamoanScandinavianScotch-IrishScottishSeminoleSenegaleseSerbianShoshoneSierra LeoneanSiouxSlavicSlovakSloveneSomaliSouth AfricanSouth AmericanSouth American IndianSoviet UnionSpaniardSpanishSpanish AmericanSpanish American IndianSri LankanSubsaharan AfricanSudaneseSwedishSwissSyrianTaiwaneseThaiTlingit-HaidaTohono O'OdhamTonganTrinidadian and TobagonianTsimshianTurkishU.S. Virgin IslanderUgandanUkrainianUruguayanUteVenezuelanVietnameseWelshWest IndianYakamaYaquiYugoslavianYumanYup'ikZimbabwean
Immigration
NonimmigrantsImmigrantsAfghanistanAfricaAlbaniaArgentinaArmeniaAsiaAustraliaAustriaBahamasBangladeshBarbadosBelarusBelgiumBelizeBoliviaBosnia and HerzegovinaBrazilBulgariaBurma/MyanmarCabo VerdeCambodiaCameroonCanadaCaribbeanCentral AmericaChileChinaColombiaCongoCosta RicaCroatiaCubaCzechoslovakiaDenmarkDominicaDominican RepublicEastern AfricaEastern AsiaEastern EuropeEcuadorEgyptEl SalvadorEnglandEritreaEthiopiaEuropeFijiFranceGhanaGreeceGrenadaGuatemalaGuyanaHaitiHondurasHong KongHungaryIndiaIndonesiaIranIraqIrelandIsraelItalyJamaicaJapanJordanKazakhstanKenyaKoreaKuwaitLaosLatin AmericaLatviaLebanonLiberiaLithuaniaMalaysiaMexicoMicronesiaMiddle AfricaMoldovaMoroccoNepalNetherlandsNicaraguaNigeriaNorth AmericaNorth MacedoniaNorthern AfricaNorthern EuropeNorwayOceaniaPakistanPanamaPeruPhilippinesPolandPortugalRomaniaRussiaSaudi ArabiaScotlandSenegalSerbiaSierra LeoneSingaporeSomaliaSouth AfricaSouth AmericaSouth Central AsiaSouth Eastern AsiaSouthern EuropeSpainSri LankaSt. Vincent and the GrenadinesSudanSwedenSwitzerlandSyriaTaiwanThailandTrinidad and TobagoTurkeyUgandaUkraineUruguayUzbekistanVenezuelaVietnamWest IndiesWestern AfricaWestern AsiaWestern EuropeYemenZaireZimbabweAzores
Child Poverty Among Girls Under 16
Income
Poverty
Unemployment
Labor Participation
Family Structure
Vehicle Availability
Education Level
Disability

Child Poverty Among Girls Under 16 Comparison

Immigrants from Germany

Guatemalans

Good
Tragic
16.1%
CHILD POVERTY AMONG GIRLS UNDER 16
67.3/ 100
METRIC RATING
165th/ 347
METRIC RANK
21.4%
CHILD POVERTY AMONG GIRLS UNDER 16
0.0/ 100
METRIC RATING
305th/ 347
METRIC RANK

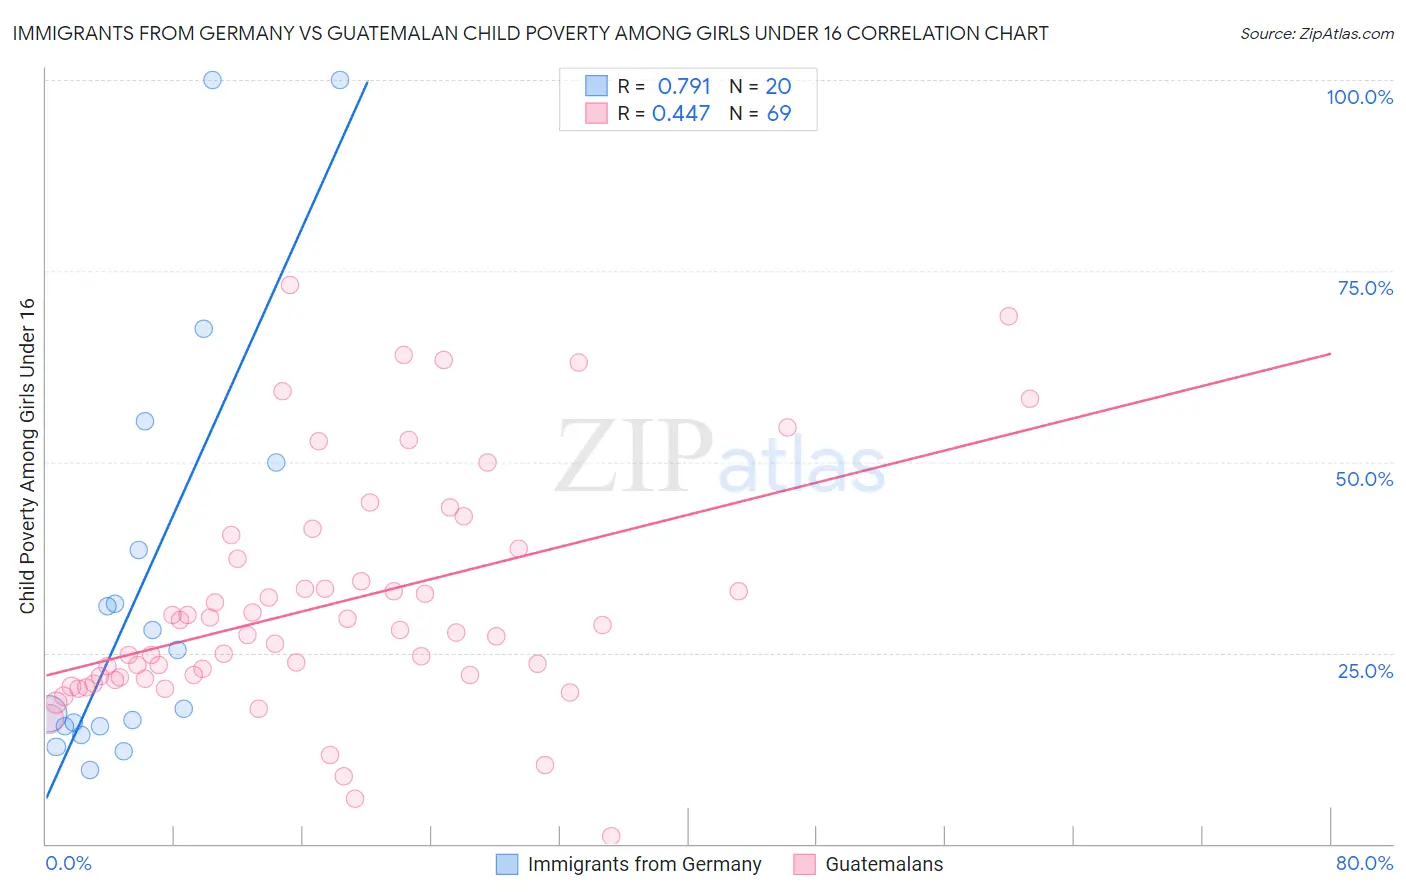
Immigrants from Germany vs Guatemalan Child Poverty Among Girls Under 16 Correlation Chart

The statistical analysis conducted on geographies consisting of 452,830,087 people shows a strong positive correlation between the proportion of Immigrants from Germany and poverty level among girls under the age of 16 in the United States with a correlation coefficient (R) of 0.791 and weighted average of 16.1%. Similarly, the statistical analysis conducted on geographies consisting of 404,016,848 people shows a moderate positive correlation between the proportion of Guatemalans and poverty level among girls under the age of 16 in the United States with a correlation coefficient (R) of 0.447 and weighted average of 21.4%, a difference of 32.7%.
Immigrants from Germany vs Guatemalan Child Poverty Among Girls Under 16

Child Poverty Among Girls Under 16 Correlation Summary

MeasurementImmigrants from GermanyGuatemalan
Minimum9.6%1.1%
Maximum100.0%73.2%
Range90.4%72.1%
Mean33.7%31.3%
Median21.5%27.6%
Interquartile 25% (IQ1)15.4%21.7%
Interquartile 75% (IQ3)44.3%37.9%
Interquartile Range (IQR)28.9%16.2%
Standard Deviation (Sample)27.6%15.3%
Standard Deviation (Population)26.9%15.2%

Similar Demographics by Child Poverty Among Girls Under 16

Demographics Similar to Immigrants from Germany by Child Poverty Among Girls Under 16

In terms of child poverty among girls under 16, the demographic groups most similar to Immigrants from Germany are South American (16.1%, a difference of 0.020%), Immigrants from Colombia (16.1%, a difference of 0.070%), Immigrants from Oceania (16.1%, a difference of 0.14%), French Canadian (16.1%, a difference of 0.19%), and Uruguayan (16.2%, a difference of 0.34%).
DemographicsRating | RankChild Poverty Among Girls Under 16
Guamanians/Chamorros
75.3
/100
|
#158
Good
15.9%
Slovaks
75.2
/100
|
#159
Good
15.9%
French
72.8
/100
|
#160
Good
16.0%
Immigrants | Northern Africa
72.0
/100
|
#161
Good
16.0%
French Canadians
68.7
/100
|
#162
Good
16.1%
Immigrants | Oceania
68.4
/100
|
#163
Good
16.1%
Immigrants | Colombia
67.8
/100
|
#164
Good
16.1%
Immigrants | Germany
67.3
/100
|
#165
Good
16.1%
South Americans
67.2
/100
|
#166
Good
16.1%
Uruguayans
64.7
/100
|
#167
Good
16.2%
Yugoslavians
64.4
/100
|
#168
Good
16.2%
Costa Ricans
64.2
/100
|
#169
Good
16.2%
Immigrants | Venezuela
64.2
/100
|
#170
Good
16.2%
Immigrants | Saudi Arabia
64.0
/100
|
#171
Good
16.2%
Afghans
62.3
/100
|
#172
Good
16.2%

Demographics Similar to Guatemalans by Child Poverty Among Girls Under 16

In terms of child poverty among girls under 16, the demographic groups most similar to Guatemalans are Immigrants from Central America (21.4%, a difference of 0.17%), Immigrants from Bahamas (21.4%, a difference of 0.18%), Houma (21.5%, a difference of 0.36%), Bahamian (21.5%, a difference of 0.48%), and Indonesian (21.3%, a difference of 0.62%).
DemographicsRating | RankChild Poverty Among Girls Under 16
Mexicans
0.0
/100
|
#298
Tragic
20.9%
Hispanics or Latinos
0.0
/100
|
#299
Tragic
21.0%
Somalis
0.0
/100
|
#300
Tragic
21.0%
Choctaw
0.0
/100
|
#301
Tragic
21.1%
Seminole
0.0
/100
|
#302
Tragic
21.2%
British West Indians
0.0
/100
|
#303
Tragic
21.3%
Indonesians
0.0
/100
|
#304
Tragic
21.3%
Guatemalans
0.0
/100
|
#305
Tragic
21.4%
Immigrants | Central America
0.0
/100
|
#306
Tragic
21.4%
Immigrants | Bahamas
0.0
/100
|
#307
Tragic
21.4%
Houma
0.0
/100
|
#308
Tragic
21.5%
Bahamians
0.0
/100
|
#309
Tragic
21.5%
Immigrants | Somalia
0.0
/100
|
#310
Tragic
21.6%
Dutch West Indians
0.0
/100
|
#311
Tragic
21.6%
Immigrants | Mexico
0.0
/100
|
#312
Tragic
21.6%