Immigrants from France vs Choctaw Male Poverty

COMPARE

Immigrants from France
Race
Ancestry
AfghanAfricanAlaska NativeAlaskan AthabascanAlbanianAleutAlsatianAmericanApacheArabArapahoArgentineanArmenianAssyrian/Chaldean/SyriacAustralianAustrianBahamianBangladeshiBarbadianBasqueBelgianBelizeanBermudanBhutaneseBlackfeetBolivianBrazilianBritishBritish West IndianBulgarianBurmeseCajunCambodianCanadianCape VerdeanCarpatho RusynCelticCentral AmericanCentral American IndianCherokeeCheyenneChickasawChileanChineseChippewaColombianColvilleComancheCosta RicanCreeCreekCroatianCrowCubanCypriotCzechCzechoslovakianDanishDelawareDominicanDutchDutch West IndianEastern EuropeanEcuadorianEgyptianEnglishEstonianEthiopianEuropeanFijianFilipinoFinnishFrenchFrench American IndianFrench CanadianGermanGerman RussianGhanaianGreekGuamanian/ChamorroGuatemalanGuyaneseHaitianHmongHonduranHopiHoumaHungarianIcelanderIndian (Asian)IndonesianInupiatIranianIraqiIrishIroquoisIsraeliItalianJamaicanJapaneseJordanianKenyanKiowaKoreanLaotianLatvianLebaneseLiberianLithuanianLumbeeLuxembourgerMacedonianMalaysianMalteseMarshalleseMenomineeMexicanMexican American IndianMongolianMoroccanNative HawaiianNavajoNepaleseNew ZealanderNicaraguanNigerianNorthern EuropeanNorwegianOkinawanOsageOttawaPaiutePakistaniPalestinianPanamanianParaguayanPennsylvania GermanPeruvianPimaPolishPortuguesePotawatomiPuebloPuerto RicanPuget Sound SalishRomanianRussianSalvadoranSamoanScandinavianScotch-IrishScottishSeminoleSenegaleseSerbianShoshoneSierra LeoneanSiouxSlavicSlovakSloveneSomaliSouth AfricanSouth AmericanSouth American IndianSoviet UnionSpaniardSpanishSpanish AmericanSpanish American IndianSri LankanSubsaharan AfricanSudaneseSwedishSwissSyrianTaiwaneseThaiTlingit-HaidaTohono O'OdhamTonganTrinidadian and TobagonianTsimshianTurkishU.S. Virgin IslanderUgandanUkrainianUruguayanUteVenezuelanVietnameseWelshWest IndianYakamaYaquiYugoslavianYumanYup'ikZimbabwean
Immigration
NonimmigrantsImmigrantsAfghanistanAfricaAlbaniaArgentinaArmeniaAsiaAustraliaAustriaBahamasBangladeshBarbadosBelarusBelgiumBelizeBoliviaBosnia and HerzegovinaBrazilBulgariaBurma/MyanmarCabo VerdeCambodiaCameroonCanadaCaribbeanCentral AmericaChileChinaColombiaCongoCosta RicaCroatiaCubaCzechoslovakiaDenmarkDominicaDominican RepublicEastern AfricaEastern AsiaEastern EuropeEcuadorEgyptEl SalvadorEnglandEritreaEthiopiaEuropeFijiFranceGermanyGhanaGreeceGrenadaGuatemalaGuyanaHaitiHondurasHong KongHungaryIndiaIndonesiaIranIraqIrelandIsraelItalyJamaicaJapanJordanKazakhstanKenyaKoreaKuwaitLaosLatin AmericaLatviaLebanonLiberiaLithuaniaMalaysiaMexicoMicronesiaMiddle AfricaMoldovaMoroccoNepalNetherlandsNicaraguaNigeriaNorth AmericaNorth MacedoniaNorthern AfricaNorthern EuropeNorwayOceaniaPakistanPanamaPeruPhilippinesPolandPortugalRomaniaRussiaSaudi ArabiaScotlandSenegalSerbiaSierra LeoneSingaporeSomaliaSouth AfricaSouth AmericaSouth Central AsiaSouth Eastern AsiaSouthern EuropeSpainSri LankaSt. Vincent and the GrenadinesSudanSwedenSwitzerlandSyriaTaiwanThailandTrinidad and TobagoTurkeyUgandaUkraineUruguayUzbekistanVenezuelaVietnamWest IndiesWestern AfricaWestern AsiaWestern EuropeYemenZaireZimbabweAzores
Choctaw
Race
Ancestry
AfghanAfricanAlaska NativeAlaskan AthabascanAlbanianAleutAlsatianAmericanApacheArabArapahoArgentineanArmenianAssyrian/Chaldean/SyriacAustralianAustrianBahamianBangladeshiBarbadianBasqueBelgianBelizeanBermudanBhutaneseBlackfeetBolivianBrazilianBritishBritish West IndianBulgarianBurmeseCajunCambodianCanadianCape VerdeanCarpatho RusynCelticCentral AmericanCentral American IndianCherokeeCheyenneChickasawChileanChineseChippewaChoctawColombianColvilleComancheCosta RicanCreeCreekCroatianCrowCubanCypriotCzechCzechoslovakianDanishDelawareDominicanDutchDutch West IndianEastern EuropeanEcuadorianEgyptianEnglishEstonianEthiopianEuropeanFijianFilipinoFinnishFrenchFrench American IndianFrench CanadianGermanGerman RussianGhanaianGreekGuamanian/ChamorroGuatemalanGuyaneseHaitianHmongHonduranHopiHoumaHungarianIcelanderIndian (Asian)IndonesianInupiatIranianIraqiIrishIroquoisIsraeliItalianJamaicanJapaneseJordanianKenyanKiowaKoreanLaotianLatvianLebaneseLiberianLithuanianLumbeeLuxembourgerMacedonianMalaysianMalteseMarshalleseMenomineeMexicanMexican American IndianMongolianMoroccanNative HawaiianNavajoNepaleseNew ZealanderNicaraguanNigerianNorthern EuropeanNorwegianOkinawanOsageOttawaPaiutePakistaniPalestinianPanamanianParaguayanPennsylvania GermanPeruvianPimaPolishPortuguesePotawatomiPuebloPuerto RicanPuget Sound SalishRomanianRussianSalvadoranSamoanScandinavianScotch-IrishScottishSeminoleSenegaleseSerbianShoshoneSierra LeoneanSiouxSlavicSlovakSloveneSomaliSouth AfricanSouth AmericanSouth American IndianSoviet UnionSpaniardSpanishSpanish AmericanSpanish American IndianSri LankanSubsaharan AfricanSudaneseSwedishSwissSyrianTaiwaneseThaiTlingit-HaidaTohono O'OdhamTonganTrinidadian and TobagonianTsimshianTurkishU.S. Virgin IslanderUgandanUkrainianUruguayanUteVenezuelanVietnameseWelshWest IndianYakamaYaquiYugoslavianYumanYup'ikZimbabwean
Immigration
NonimmigrantsImmigrantsAfghanistanAfricaAlbaniaArgentinaArmeniaAsiaAustraliaAustriaBahamasBangladeshBarbadosBelarusBelgiumBelizeBoliviaBosnia and HerzegovinaBrazilBulgariaBurma/MyanmarCabo VerdeCambodiaCameroonCanadaCaribbeanCentral AmericaChileChinaColombiaCongoCosta RicaCroatiaCubaCzechoslovakiaDenmarkDominicaDominican RepublicEastern AfricaEastern AsiaEastern EuropeEcuadorEgyptEl SalvadorEnglandEritreaEthiopiaEuropeFijiGermanyGhanaGreeceGrenadaGuatemalaGuyanaHaitiHondurasHong KongHungaryIndiaIndonesiaIranIraqIrelandIsraelItalyJamaicaJapanJordanKazakhstanKenyaKoreaKuwaitLaosLatin AmericaLatviaLebanonLiberiaLithuaniaMalaysiaMexicoMicronesiaMiddle AfricaMoldovaMoroccoNepalNetherlandsNicaraguaNigeriaNorth AmericaNorth MacedoniaNorthern AfricaNorthern EuropeNorwayOceaniaPakistanPanamaPeruPhilippinesPolandPortugalRomaniaRussiaSaudi ArabiaScotlandSenegalSerbiaSierra LeoneSingaporeSomaliaSouth AfricaSouth AmericaSouth Central AsiaSouth Eastern AsiaSouthern EuropeSpainSri LankaSt. Vincent and the GrenadinesSudanSwedenSwitzerlandSyriaTaiwanThailandTrinidad and TobagoTurkeyUgandaUkraineUruguayUzbekistanVenezuelaVietnamWest IndiesWestern AfricaWestern AsiaWestern EuropeYemenZaireZimbabweAzores
Male Poverty
Income
Poverty
Unemployment
Labor Participation
Family Structure
Vehicle Availability
Education Level
Disability

Male Poverty Comparison

Immigrants from France

Choctaw

Good
Tragic
10.9%
MALE POVERTY
75.8/ 100
METRIC RATING
141st/ 347
METRIC RANK
14.4%
MALE POVERTY
0.0/ 100
METRIC RATING
312th/ 347
METRIC RANK

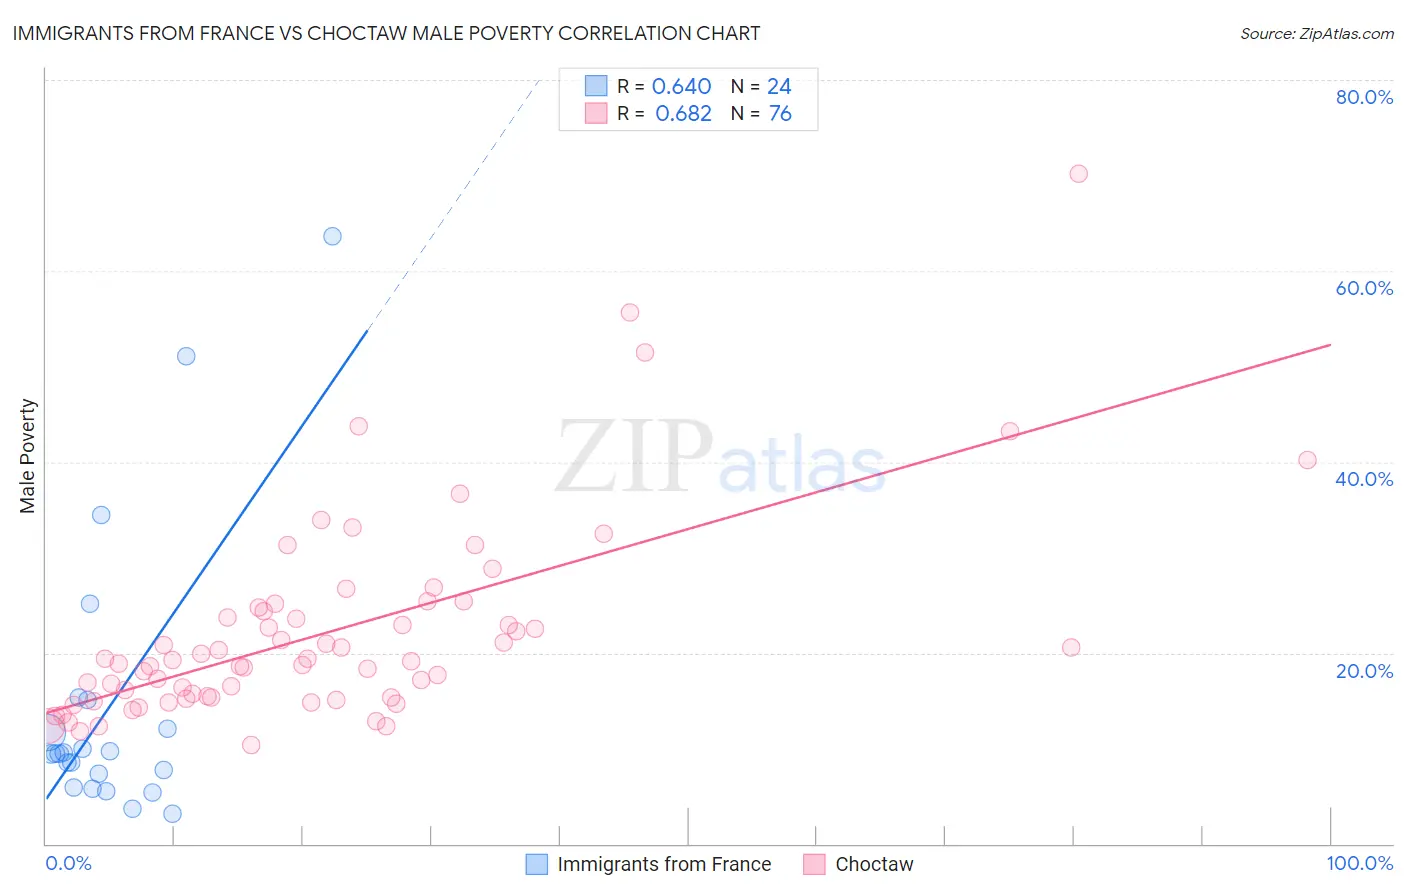
Immigrants from France vs Choctaw Male Poverty Correlation Chart

The statistical analysis conducted on geographies consisting of 287,760,426 people shows a significant positive correlation between the proportion of Immigrants from France and poverty level among males in the United States with a correlation coefficient (R) of 0.640 and weighted average of 10.9%. Similarly, the statistical analysis conducted on geographies consisting of 269,566,788 people shows a significant positive correlation between the proportion of Choctaw and poverty level among males in the United States with a correlation coefficient (R) of 0.682 and weighted average of 14.4%, a difference of 32.3%.
Immigrants from France vs Choctaw Male Poverty

Male Poverty Correlation Summary

MeasurementImmigrants from FranceChoctaw
Minimum3.1%10.4%
Maximum63.6%70.2%
Range60.5%59.8%
Mean14.5%22.2%
Median9.5%19.2%
Interquartile 25% (IQ1)6.6%15.3%
Interquartile 75% (IQ3)13.6%24.6%
Interquartile Range (IQR)6.9%9.3%
Standard Deviation (Sample)15.0%10.5%
Standard Deviation (Population)14.7%10.5%

Similar Demographics by Male Poverty

Demographics Similar to Immigrants from France by Male Poverty

In terms of male poverty, the demographic groups most similar to Immigrants from France are Tlingit-Haida (10.9%, a difference of 0.030%), Basque (10.9%, a difference of 0.17%), Immigrants from Jordan (10.8%, a difference of 0.23%), Yugoslavian (10.8%, a difference of 0.34%), and Immigrants from Switzerland (10.8%, a difference of 0.49%).
DemographicsRating | RankMale Poverty
New Zealanders
82.9
/100
|
#134
Excellent
10.8%
Brazilians
82.7
/100
|
#135
Excellent
10.8%
Immigrants | Israel
80.9
/100
|
#136
Excellent
10.8%
Immigrants | Switzerland
79.2
/100
|
#137
Good
10.8%
Yugoslavians
78.2
/100
|
#138
Good
10.8%
Immigrants | Jordan
77.5
/100
|
#139
Good
10.8%
Tlingit-Haida
76.1
/100
|
#140
Good
10.9%
Immigrants | France
75.8
/100
|
#141
Good
10.9%
Basques
74.6
/100
|
#142
Good
10.9%
Afghans
71.9
/100
|
#143
Good
10.9%
Samoans
71.8
/100
|
#144
Good
10.9%
Immigrants | Germany
71.6
/100
|
#145
Good
10.9%
Syrians
71.4
/100
|
#146
Good
10.9%
Icelanders
68.5
/100
|
#147
Good
11.0%
Armenians
68.0
/100
|
#148
Good
11.0%

Demographics Similar to Choctaw by Male Poverty

In terms of male poverty, the demographic groups most similar to Choctaw are Honduran (14.3%, a difference of 0.47%), Seminole (14.3%, a difference of 0.67%), Somali (14.3%, a difference of 0.88%), African (14.2%, a difference of 1.3%), and Dutch West Indian (14.2%, a difference of 1.3%).
DemographicsRating | RankMale Poverty
Immigrants | Bangladesh
0.0
/100
|
#305
Tragic
14.1%
Creek
0.0
/100
|
#306
Tragic
14.1%
Dutch West Indians
0.0
/100
|
#307
Tragic
14.2%
Africans
0.0
/100
|
#308
Tragic
14.2%
Somalis
0.0
/100
|
#309
Tragic
14.3%
Seminole
0.0
/100
|
#310
Tragic
14.3%
Hondurans
0.0
/100
|
#311
Tragic
14.3%
Choctaw
0.0
/100
|
#312
Tragic
14.4%
Immigrants | Somalia
0.0
/100
|
#313
Tragic
14.6%
Immigrants | Honduras
0.0
/100
|
#314
Tragic
14.6%
Chippewa
0.0
/100
|
#315
Tragic
14.6%
British West Indians
0.0
/100
|
#316
Tragic
14.6%
Immigrants | Dominica
0.0
/100
|
#317
Tragic
14.7%
Immigrants | Grenada
0.0
/100
|
#318
Tragic
14.7%
U.S. Virgin Islanders
0.0
/100
|
#319
Tragic
14.7%