Immigrants from Europe vs European Single Female Poverty
COMPARE
Immigrants from Europe
European
Single Female Poverty
Single Female Poverty Comparison
Immigrants from Europe
Europeans
19.2%
SINGLE FEMALE POVERTY
99.6/ 100
METRIC RATING
64th/ 347
METRIC RANK
21.1%
SINGLE FEMALE POVERTY
42.3/ 100
METRIC RATING
181st/ 347
METRIC RANK
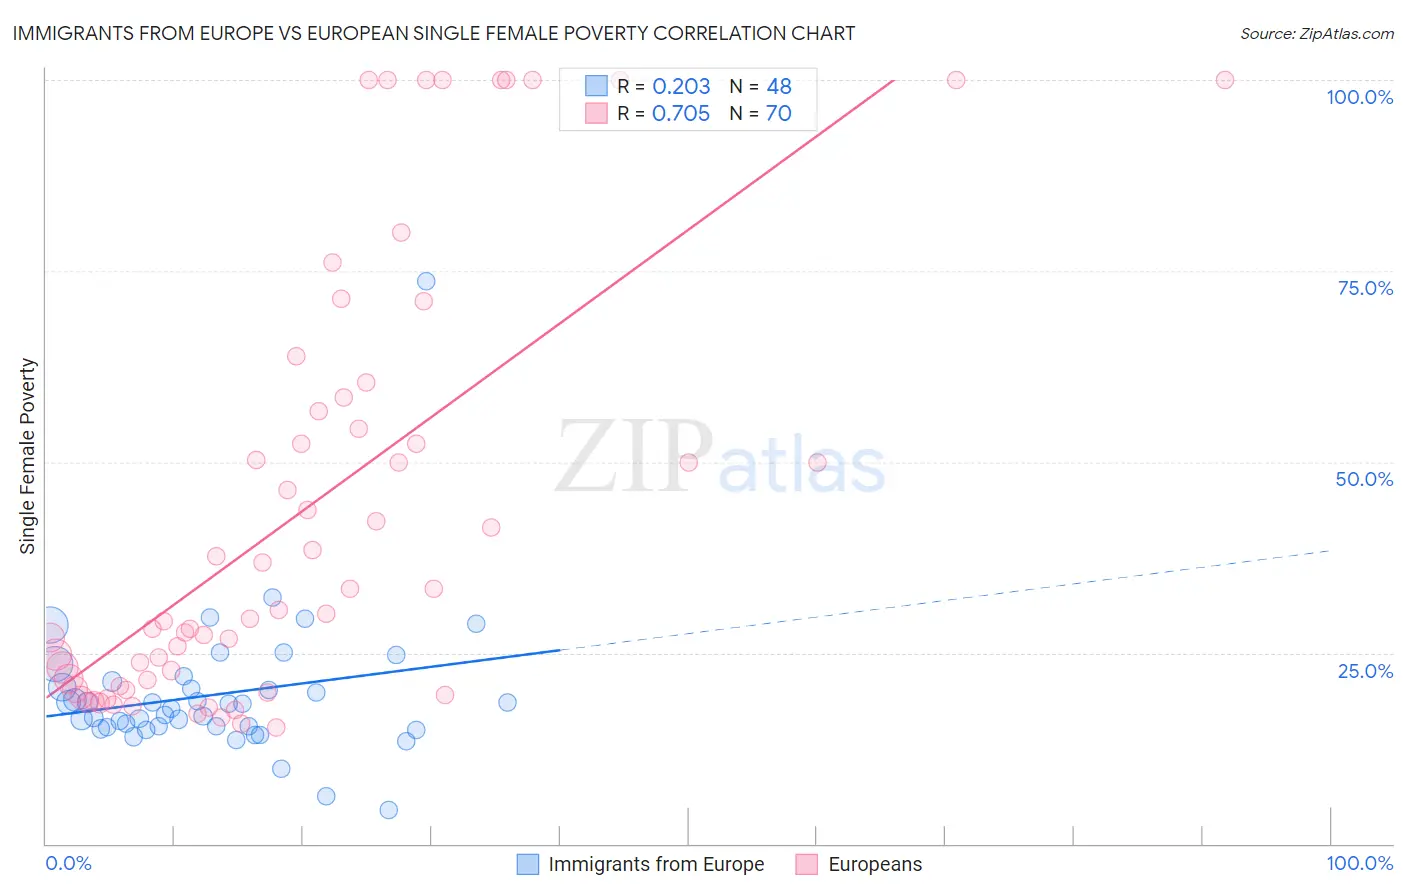
Immigrants from Europe vs European Single Female Poverty Correlation Chart
The statistical analysis conducted on geographies consisting of 530,423,700 people shows a weak positive correlation between the proportion of Immigrants from Europe and poverty level among single females in the United States with a correlation coefficient (R) of 0.203 and weighted average of 19.2%. Similarly, the statistical analysis conducted on geographies consisting of 543,036,354 people shows a strong positive correlation between the proportion of Europeans and poverty level among single females in the United States with a correlation coefficient (R) of 0.705 and weighted average of 21.1%, a difference of 9.8%.
Single Female Poverty Correlation Summary
| Measurement | Immigrants from Europe | European |
| Minimum | 4.4% | 15.3% |
| Maximum | 73.7% | 100.0% |
| Range | 69.3% | 84.7% |
| Mean | 19.5% | 43.6% |
| Median | 18.0% | 30.4% |
| Interquartile 25% (IQ1) | 15.3% | 20.6% |
| Interquartile 75% (IQ3) | 20.8% | 56.6% |
| Interquartile Range (IQR) | 5.6% | 36.0% |
| Standard Deviation (Sample) | 9.7% | 28.1% |
| Standard Deviation (Population) | 9.6% | 27.9% |
Similar Demographics by Single Female Poverty
Demographics Similar to Immigrants from Europe by Single Female Poverty
In terms of single female poverty, the demographic groups most similar to Immigrants from Europe are Immigrants from Northern Europe (19.2%, a difference of 0.0%), Cypriot (19.2%, a difference of 0.030%), Palestinian (19.2%, a difference of 0.040%), Immigrants from Egypt (19.2%, a difference of 0.080%), and Laotian (19.3%, a difference of 0.12%).
| Demographics | Rating | Rank | Single Female Poverty |
| Eastern Europeans | 99.7 /100 | #57 | Exceptional 19.1% |
| Immigrants | Bulgaria | 99.7 /100 | #58 | Exceptional 19.1% |
| Sri Lankans | 99.6 /100 | #59 | Exceptional 19.2% |
| Russians | 99.6 /100 | #60 | Exceptional 19.2% |
| Cambodians | 99.6 /100 | #61 | Exceptional 19.2% |
| Lithuanians | 99.6 /100 | #62 | Exceptional 19.2% |
| Immigrants | Northern Europe | 99.6 /100 | #63 | Exceptional 19.2% |
| Immigrants | Europe | 99.6 /100 | #64 | Exceptional 19.2% |
| Cypriots | 99.6 /100 | #65 | Exceptional 19.2% |
| Palestinians | 99.6 /100 | #66 | Exceptional 19.2% |
| Immigrants | Egypt | 99.6 /100 | #67 | Exceptional 19.2% |
| Laotians | 99.5 /100 | #68 | Exceptional 19.3% |
| Paraguayans | 99.5 /100 | #69 | Exceptional 19.3% |
| Immigrants | Jordan | 99.4 /100 | #70 | Exceptional 19.3% |
| Immigrants | South Eastern Asia | 99.4 /100 | #71 | Exceptional 19.3% |
Demographics Similar to Europeans by Single Female Poverty
In terms of single female poverty, the demographic groups most similar to Europeans are Spanish American Indian (21.1%, a difference of 0.010%), British (21.1%, a difference of 0.040%), Slavic (21.1%, a difference of 0.12%), Immigrants from Bosnia and Herzegovina (21.1%, a difference of 0.16%), and Slovak (21.1%, a difference of 0.17%).
| Demographics | Rating | Rank | Single Female Poverty |
| Cubans | 50.0 /100 | #174 | Average 21.0% |
| Czechs | 46.8 /100 | #175 | Average 21.0% |
| Canadians | 45.4 /100 | #176 | Average 21.1% |
| Scandinavians | 45.2 /100 | #177 | Average 21.1% |
| Immigrants | Bosnia and Herzegovina | 44.9 /100 | #178 | Average 21.1% |
| British | 42.9 /100 | #179 | Average 21.1% |
| Spanish American Indians | 42.5 /100 | #180 | Average 21.1% |
| Europeans | 42.3 /100 | #181 | Average 21.1% |
| Slavs | 40.5 /100 | #182 | Average 21.1% |
| Slovaks | 39.7 /100 | #183 | Fair 21.1% |
| Hungarians | 39.6 /100 | #184 | Fair 21.1% |
| Immigrants | Cambodia | 38.2 /100 | #185 | Fair 21.2% |
| Hawaiians | 37.7 /100 | #186 | Fair 21.2% |
| Immigrants | Nigeria | 36.8 /100 | #187 | Fair 21.2% |
| Yugoslavians | 35.4 /100 | #188 | Fair 21.2% |