Alsatian vs European Single Female Poverty
COMPARE
Alsatian
European
Single Female Poverty
Single Female Poverty Comparison
Alsatians
Europeans
24.5%
SINGLE FEMALE POVERTY
0.0/ 100
METRIC RATING
292nd/ 347
METRIC RANK
21.1%
SINGLE FEMALE POVERTY
42.3/ 100
METRIC RATING
181st/ 347
METRIC RANK
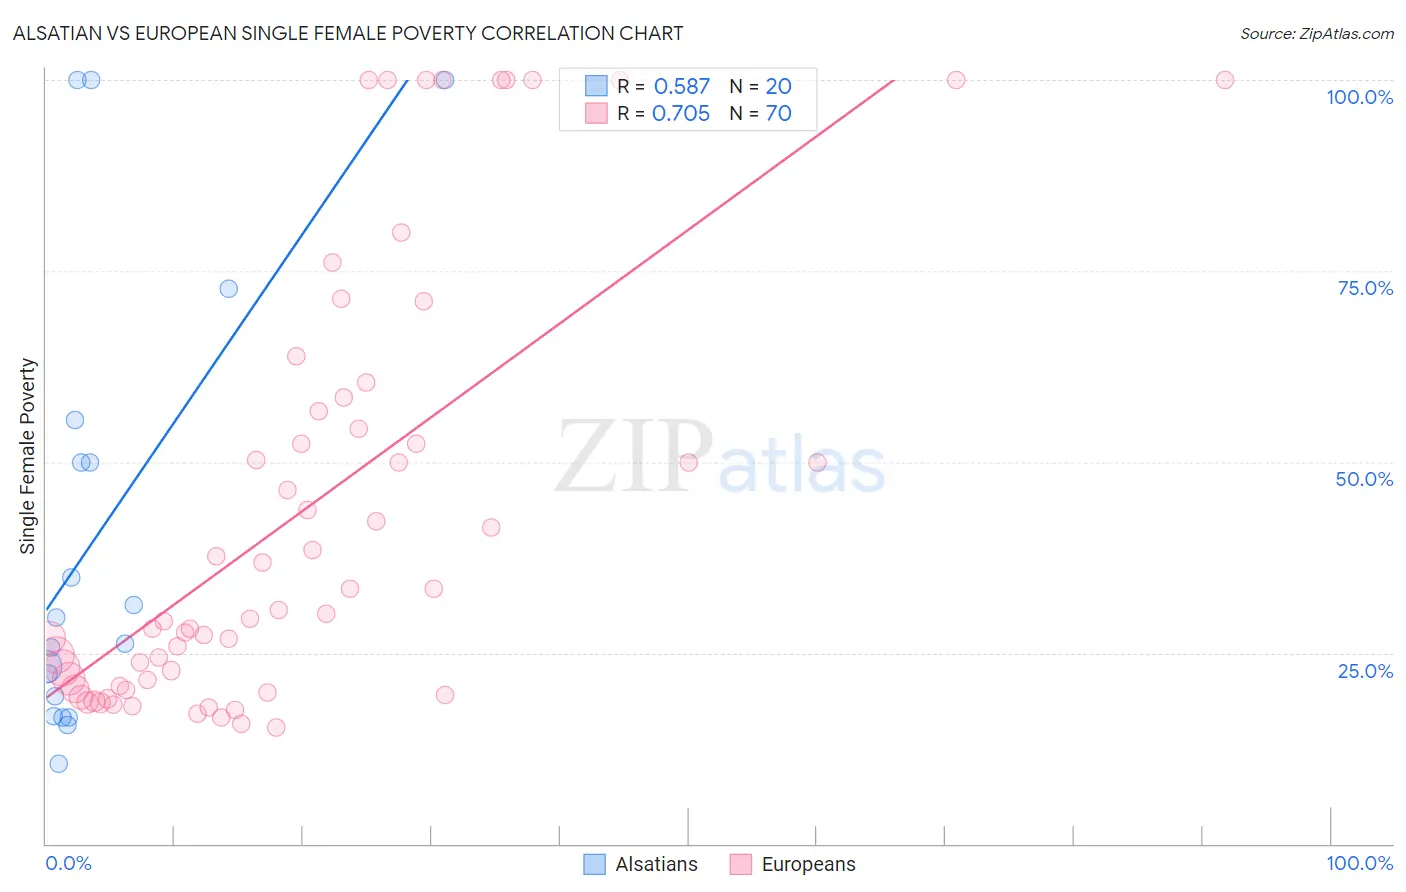
Alsatian vs European Single Female Poverty Correlation Chart
The statistical analysis conducted on geographies consisting of 82,305,024 people shows a substantial positive correlation between the proportion of Alsatians and poverty level among single females in the United States with a correlation coefficient (R) of 0.587 and weighted average of 24.5%. Similarly, the statistical analysis conducted on geographies consisting of 543,036,354 people shows a strong positive correlation between the proportion of Europeans and poverty level among single females in the United States with a correlation coefficient (R) of 0.705 and weighted average of 21.1%, a difference of 16.0%.
Single Female Poverty Correlation Summary
| Measurement | Alsatian | European |
| Minimum | 10.5% | 15.3% |
| Maximum | 100.0% | 100.0% |
| Range | 89.5% | 84.7% |
| Mean | 40.8% | 43.6% |
| Median | 27.9% | 30.4% |
| Interquartile 25% (IQ1) | 18.1% | 20.6% |
| Interquartile 75% (IQ3) | 52.7% | 56.6% |
| Interquartile Range (IQR) | 34.6% | 36.0% |
| Standard Deviation (Sample) | 30.0% | 28.1% |
| Standard Deviation (Population) | 29.2% | 27.9% |
Similar Demographics by Single Female Poverty
Demographics Similar to Alsatians by Single Female Poverty
In terms of single female poverty, the demographic groups most similar to Alsatians are American (24.5%, a difference of 0.080%), French American Indian (24.6%, a difference of 0.23%), Osage (24.4%, a difference of 0.37%), Hispanic or Latino (24.6%, a difference of 0.57%), and Indonesian (24.3%, a difference of 0.97%).
| Demographics | Rating | Rank | Single Female Poverty |
| Immigrants | Guatemala | 0.0 /100 | #285 | Tragic 24.1% |
| Cree | 0.0 /100 | #286 | Tragic 24.1% |
| Bangladeshis | 0.0 /100 | #287 | Tragic 24.2% |
| Spanish Americans | 0.0 /100 | #288 | Tragic 24.2% |
| U.S. Virgin Islanders | 0.0 /100 | #289 | Tragic 24.2% |
| Indonesians | 0.0 /100 | #290 | Tragic 24.3% |
| Osage | 0.0 /100 | #291 | Tragic 24.4% |
| Alsatians | 0.0 /100 | #292 | Tragic 24.5% |
| Americans | 0.0 /100 | #293 | Tragic 24.5% |
| French American Indians | 0.0 /100 | #294 | Tragic 24.6% |
| Hispanics or Latinos | 0.0 /100 | #295 | Tragic 24.6% |
| Africans | 0.0 /100 | #296 | Tragic 24.8% |
| Immigrants | Central America | 0.0 /100 | #297 | Tragic 24.8% |
| Yaqui | 0.0 /100 | #298 | Tragic 24.9% |
| Mexicans | 0.0 /100 | #299 | Tragic 25.0% |
Demographics Similar to Europeans by Single Female Poverty
In terms of single female poverty, the demographic groups most similar to Europeans are Spanish American Indian (21.1%, a difference of 0.010%), British (21.1%, a difference of 0.040%), Slavic (21.1%, a difference of 0.12%), Immigrants from Bosnia and Herzegovina (21.1%, a difference of 0.16%), and Slovak (21.1%, a difference of 0.17%).
| Demographics | Rating | Rank | Single Female Poverty |
| Cubans | 50.0 /100 | #174 | Average 21.0% |
| Czechs | 46.8 /100 | #175 | Average 21.0% |
| Canadians | 45.4 /100 | #176 | Average 21.1% |
| Scandinavians | 45.2 /100 | #177 | Average 21.1% |
| Immigrants | Bosnia and Herzegovina | 44.9 /100 | #178 | Average 21.1% |
| British | 42.9 /100 | #179 | Average 21.1% |
| Spanish American Indians | 42.5 /100 | #180 | Average 21.1% |
| Europeans | 42.3 /100 | #181 | Average 21.1% |
| Slavs | 40.5 /100 | #182 | Average 21.1% |
| Slovaks | 39.7 /100 | #183 | Fair 21.1% |
| Hungarians | 39.6 /100 | #184 | Fair 21.1% |
| Immigrants | Cambodia | 38.2 /100 | #185 | Fair 21.2% |
| Hawaiians | 37.7 /100 | #186 | Fair 21.2% |
| Immigrants | Nigeria | 36.8 /100 | #187 | Fair 21.2% |
| Yugoslavians | 35.4 /100 | #188 | Fair 21.2% |