Immigrants from England vs Salvadoran Child Poverty Among Girls Under 16

COMPARE

Immigrants from England
Race
Ancestry
AfghanAfricanAlaska NativeAlaskan AthabascanAlbanianAleutAlsatianAmericanApacheArabArapahoArgentineanArmenianAssyrian/Chaldean/SyriacAustralianAustrianBahamianBangladeshiBarbadianBasqueBelgianBelizeanBermudanBhutaneseBlackfeetBolivianBrazilianBritishBritish West IndianBulgarianBurmeseCajunCambodianCanadianCape VerdeanCarpatho RusynCelticCentral AmericanCentral American IndianCherokeeCheyenneChickasawChileanChineseChippewaChoctawColombianColvilleComancheCosta RicanCreeCreekCroatianCrowCubanCypriotCzechCzechoslovakianDanishDelawareDominicanDutchDutch West IndianEastern EuropeanEcuadorianEgyptianEnglishEstonianEthiopianEuropeanFijianFilipinoFinnishFrenchFrench American IndianFrench CanadianGermanGerman RussianGhanaianGreekGuamanian/ChamorroGuatemalanGuyaneseHaitianHmongHonduranHopiHoumaHungarianIcelanderIndian (Asian)IndonesianInupiatIranianIraqiIrishIroquoisIsraeliItalianJamaicanJapaneseJordanianKenyanKiowaKoreanLaotianLatvianLebaneseLiberianLithuanianLumbeeLuxembourgerMacedonianMalaysianMalteseMarshalleseMenomineeMexicanMexican American IndianMongolianMoroccanNative HawaiianNavajoNepaleseNew ZealanderNicaraguanNigerianNorthern EuropeanNorwegianOkinawanOsageOttawaPaiutePakistaniPalestinianPanamanianParaguayanPennsylvania GermanPeruvianPimaPolishPortuguesePotawatomiPuebloPuerto RicanPuget Sound SalishRomanianRussianSamoanScandinavianScotch-IrishScottishSeminoleSenegaleseSerbianShoshoneSierra LeoneanSiouxSlavicSlovakSloveneSomaliSouth AfricanSouth AmericanSouth American IndianSoviet UnionSpaniardSpanishSpanish AmericanSpanish American IndianSri LankanSubsaharan AfricanSudaneseSwedishSwissSyrianTaiwaneseThaiTlingit-HaidaTohono O'OdhamTonganTrinidadian and TobagonianTsimshianTurkishU.S. Virgin IslanderUgandanUkrainianUruguayanUteVenezuelanVietnameseWelshWest IndianYakamaYaquiYugoslavianYumanYup'ikZimbabwean
Immigration
NonimmigrantsImmigrantsAfghanistanAfricaAlbaniaArgentinaArmeniaAsiaAustraliaAustriaBahamasBangladeshBarbadosBelarusBelgiumBelizeBoliviaBosnia and HerzegovinaBrazilBulgariaBurma/MyanmarCabo VerdeCambodiaCameroonCanadaCaribbeanCentral AmericaChileChinaColombiaCongoCosta RicaCroatiaCubaCzechoslovakiaDenmarkDominicaDominican RepublicEastern AfricaEastern AsiaEastern EuropeEcuadorEgyptEl SalvadorEnglandEritreaEthiopiaEuropeFijiFranceGermanyGhanaGreeceGrenadaGuatemalaGuyanaHaitiHondurasHong KongHungaryIndiaIndonesiaIranIraqIrelandIsraelItalyJamaicaJapanJordanKazakhstanKenyaKoreaKuwaitLaosLatin AmericaLatviaLebanonLiberiaLithuaniaMalaysiaMexicoMicronesiaMiddle AfricaMoldovaMoroccoNepalNetherlandsNicaraguaNigeriaNorth AmericaNorth MacedoniaNorthern AfricaNorthern EuropeNorwayOceaniaPakistanPanamaPeruPhilippinesPolandPortugalRomaniaRussiaSaudi ArabiaScotlandSenegalSerbiaSierra LeoneSingaporeSomaliaSouth AfricaSouth AmericaSouth Central AsiaSouth Eastern AsiaSouthern EuropeSpainSri LankaSt. Vincent and the GrenadinesSudanSwedenSwitzerlandSyriaTaiwanThailandTrinidad and TobagoTurkeyUgandaUkraineUruguayUzbekistanVenezuelaVietnamWest IndiesWestern AfricaWestern AsiaWestern EuropeYemenZaireZimbabweAzores
Salvadoran
Race
Ancestry
AfghanAfricanAlaska NativeAlaskan AthabascanAlbanianAleutAlsatianAmericanApacheArabArapahoArgentineanArmenianAssyrian/Chaldean/SyriacAustralianAustrianBahamianBangladeshiBarbadianBasqueBelgianBelizeanBermudanBhutaneseBlackfeetBolivianBrazilianBritishBritish West IndianBulgarianBurmeseCajunCambodianCanadianCape VerdeanCarpatho RusynCelticCentral AmericanCentral American IndianCherokeeCheyenneChickasawChileanChineseChippewaChoctawColombianColvilleComancheCosta RicanCreeCreekCroatianCrowCubanCypriotCzechCzechoslovakianDanishDelawareDominicanDutchDutch West IndianEastern EuropeanEcuadorianEgyptianEnglishEstonianEthiopianEuropeanFijianFilipinoFinnishFrenchFrench American IndianFrench CanadianGermanGerman RussianGhanaianGreekGuamanian/ChamorroGuatemalanGuyaneseHaitianHmongHonduranHopiHoumaHungarianIcelanderIndian (Asian)IndonesianInupiatIranianIraqiIrishIroquoisIsraeliItalianJamaicanJapaneseJordanianKenyanKiowaKoreanLaotianLatvianLebaneseLiberianLithuanianLumbeeLuxembourgerMacedonianMalaysianMalteseMarshalleseMenomineeMexicanMexican American IndianMongolianMoroccanNative HawaiianNavajoNepaleseNew ZealanderNicaraguanNigerianNorthern EuropeanNorwegianOkinawanOsageOttawaPaiutePakistaniPalestinianPanamanianParaguayanPennsylvania GermanPeruvianPimaPolishPortuguesePotawatomiPuebloPuerto RicanPuget Sound SalishRomanianRussianSalvadoranSamoanScandinavianScotch-IrishScottishSeminoleSenegaleseSerbianShoshoneSierra LeoneanSiouxSlavicSlovakSloveneSomaliSouth AfricanSouth AmericanSouth American IndianSoviet UnionSpaniardSpanishSpanish AmericanSpanish American IndianSri LankanSubsaharan AfricanSudaneseSwedishSwissSyrianTaiwaneseThaiTlingit-HaidaTohono O'OdhamTonganTrinidadian and TobagonianTsimshianTurkishU.S. Virgin IslanderUgandanUkrainianUruguayanUteVenezuelanVietnameseWelshWest IndianYakamaYaquiYugoslavianYumanYup'ikZimbabwean
Immigration
NonimmigrantsImmigrantsAfghanistanAfricaAlbaniaArgentinaArmeniaAsiaAustraliaAustriaBahamasBangladeshBarbadosBelarusBelgiumBelizeBoliviaBosnia and HerzegovinaBrazilBulgariaBurma/MyanmarCabo VerdeCambodiaCameroonCanadaCaribbeanCentral AmericaChileChinaColombiaCongoCosta RicaCroatiaCubaCzechoslovakiaDenmarkDominicaDominican RepublicEastern AfricaEastern AsiaEastern EuropeEcuadorEgyptEl SalvadorEritreaEthiopiaEuropeFijiFranceGermanyGhanaGreeceGrenadaGuatemalaGuyanaHaitiHondurasHong KongHungaryIndiaIndonesiaIranIraqIrelandIsraelItalyJamaicaJapanJordanKazakhstanKenyaKoreaKuwaitLaosLatin AmericaLatviaLebanonLiberiaLithuaniaMalaysiaMexicoMicronesiaMiddle AfricaMoldovaMoroccoNepalNetherlandsNicaraguaNigeriaNorth AmericaNorth MacedoniaNorthern AfricaNorthern EuropeNorwayOceaniaPakistanPanamaPeruPhilippinesPolandPortugalRomaniaRussiaSaudi ArabiaScotlandSenegalSerbiaSierra LeoneSingaporeSomaliaSouth AfricaSouth AmericaSouth Central AsiaSouth Eastern AsiaSouthern EuropeSpainSri LankaSt. Vincent and the GrenadinesSudanSwedenSwitzerlandSyriaTaiwanThailandTrinidad and TobagoTurkeyUgandaUkraineUruguayUzbekistanVenezuelaVietnamWest IndiesWestern AfricaWestern AsiaWestern EuropeYemenZaireZimbabweAzores
Child Poverty Among Girls Under 16
Income
Poverty
Unemployment
Labor Participation
Family Structure
Vehicle Availability
Education Level
Disability

Child Poverty Among Girls Under 16 Comparison

Immigrants from England

Salvadorans

Exceptional
Tragic
15.1%
CHILD POVERTY AMONG GIRLS UNDER 16
95.1/ 100
METRIC RATING
105th/ 347
METRIC RANK
19.4%
CHILD POVERTY AMONG GIRLS UNDER 16
0.2/ 100
METRIC RATING
258th/ 347
METRIC RANK

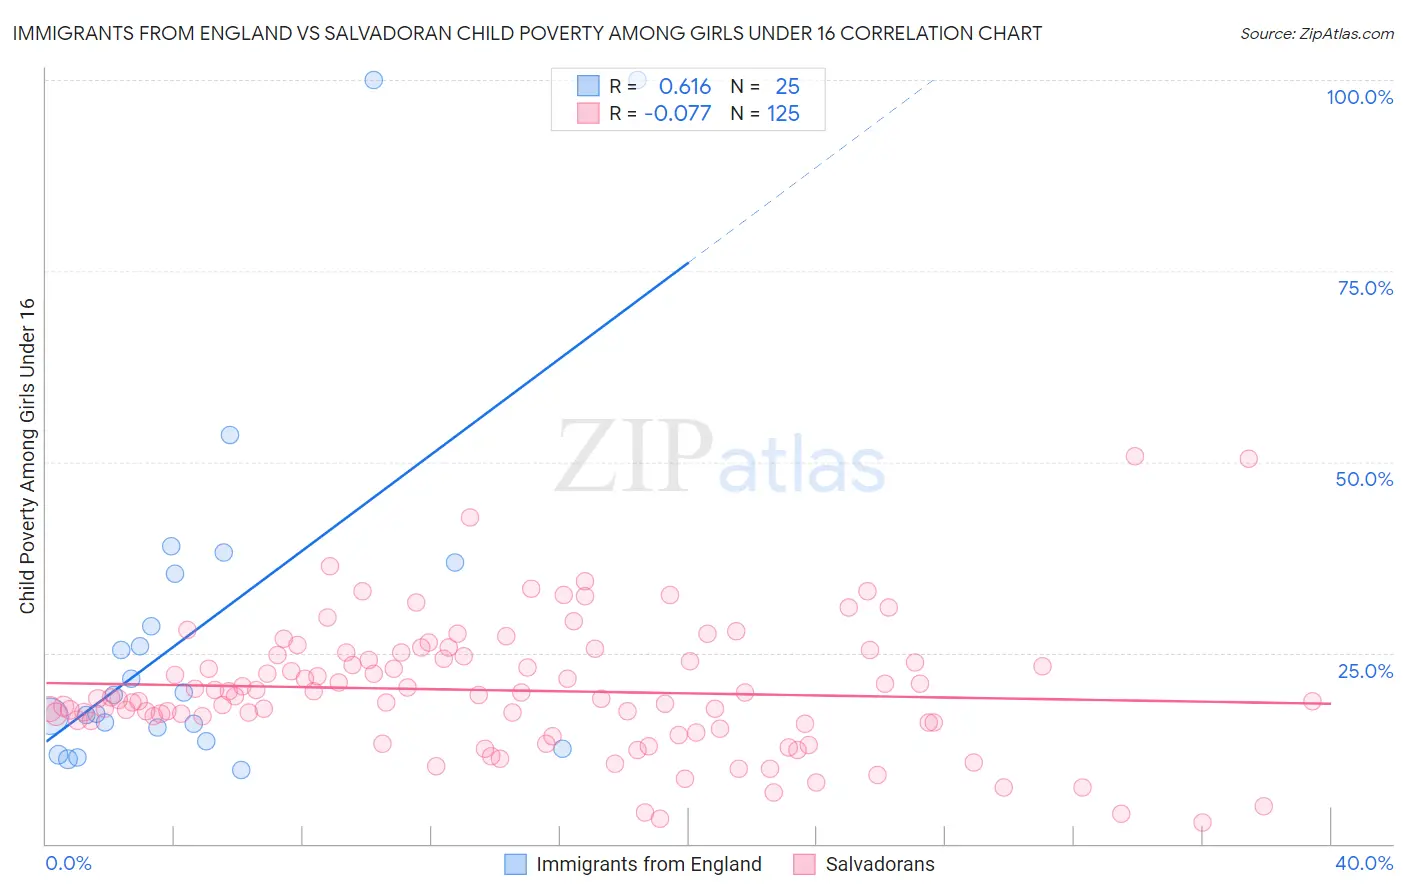
Immigrants from England vs Salvadoran Child Poverty Among Girls Under 16 Correlation Chart

The statistical analysis conducted on geographies consisting of 383,466,491 people shows a significant positive correlation between the proportion of Immigrants from England and poverty level among girls under the age of 16 in the United States with a correlation coefficient (R) of 0.616 and weighted average of 15.1%. Similarly, the statistical analysis conducted on geographies consisting of 393,655,478 people shows a slight negative correlation between the proportion of Salvadorans and poverty level among girls under the age of 16 in the United States with a correlation coefficient (R) of -0.077 and weighted average of 19.4%, a difference of 28.7%.
Immigrants from England vs Salvadoran Child Poverty Among Girls Under 16

Child Poverty Among Girls Under 16 Correlation Summary

MeasurementImmigrants from EnglandSalvadoran
Minimum9.7%2.8%
Maximum100.0%50.8%
Range90.3%48.0%
Mean28.4%20.1%
Median19.5%19.2%
Interquartile 25% (IQ1)14.3%15.8%
Interquartile 75% (IQ3)36.1%24.6%
Interquartile Range (IQR)21.8%8.8%
Standard Deviation (Sample)24.2%8.4%
Standard Deviation (Population)23.7%8.4%

Similar Demographics by Child Poverty Among Girls Under 16

Demographics Similar to Immigrants from England by Child Poverty Among Girls Under 16

In terms of child poverty among girls under 16, the demographic groups most similar to Immigrants from England are Chilean (15.1%, a difference of 0.010%), Immigrants from Ukraine (15.1%, a difference of 0.070%), Romanian (15.0%, a difference of 0.14%), Immigrants from Brazil (15.1%, a difference of 0.14%), and Serbian (15.1%, a difference of 0.23%).
DemographicsRating | RankChild Poverty Among Girls Under 16
Basques
95.9
/100
|
#98
Exceptional
15.0%
Immigrants | Egypt
95.7
/100
|
#99
Exceptional
15.0%
Paraguayans
95.7
/100
|
#100
Exceptional
15.0%
Immigrants | South Africa
95.6
/100
|
#101
Exceptional
15.0%
Immigrants | Malaysia
95.6
/100
|
#102
Exceptional
15.0%
British
95.6
/100
|
#103
Exceptional
15.0%
Romanians
95.3
/100
|
#104
Exceptional
15.0%
Immigrants | England
95.1
/100
|
#105
Exceptional
15.1%
Chileans
95.1
/100
|
#106
Exceptional
15.1%
Immigrants | Ukraine
95.0
/100
|
#107
Exceptional
15.1%
Immigrants | Brazil
94.9
/100
|
#108
Exceptional
15.1%
Serbians
94.8
/100
|
#109
Exceptional
15.1%
Immigrants | Croatia
94.6
/100
|
#110
Exceptional
15.1%
Palestinians
94.5
/100
|
#111
Exceptional
15.1%
Immigrants | Kazakhstan
94.3
/100
|
#112
Exceptional
15.1%

Demographics Similar to Salvadorans by Child Poverty Among Girls Under 16

In terms of child poverty among girls under 16, the demographic groups most similar to Salvadorans are Ottawa (19.4%, a difference of 0.10%), Guyanese (19.4%, a difference of 0.13%), Trinidadian and Tobagonian (19.3%, a difference of 0.37%), Immigrants from Ecuador (19.3%, a difference of 0.44%), and Immigrants from Western Africa (19.3%, a difference of 0.46%).
DemographicsRating | RankChild Poverty Among Girls Under 16
Immigrants | Trinidad and Tobago
0.3
/100
|
#251
Tragic
19.2%
Immigrants | Middle Africa
0.3
/100
|
#252
Tragic
19.2%
Immigrants | Guyana
0.3
/100
|
#253
Tragic
19.3%
Immigrants | Western Africa
0.3
/100
|
#254
Tragic
19.3%
Immigrants | Ecuador
0.3
/100
|
#255
Tragic
19.3%
Trinidadians and Tobagonians
0.2
/100
|
#256
Tragic
19.3%
Guyanese
0.2
/100
|
#257
Tragic
19.4%
Salvadorans
0.2
/100
|
#258
Tragic
19.4%
Ottawa
0.2
/100
|
#259
Tragic
19.4%
Mexican American Indians
0.2
/100
|
#260
Tragic
19.5%
Vietnamese
0.2
/100
|
#261
Tragic
19.5%
Chickasaw
0.1
/100
|
#262
Tragic
19.6%
Immigrants | Burma/Myanmar
0.1
/100
|
#263
Tragic
19.7%
Jamaicans
0.1
/100
|
#264
Tragic
19.7%
Immigrants | Jamaica
0.1
/100
|
#265
Tragic
19.8%