Immigrants from Eastern Asia vs Immigrants from Barbados Child Poverty Among Girls Under 16
COMPARE
Immigrants from Eastern Asia
Immigrants from Barbados
Child Poverty Among Girls Under 16
Child Poverty Among Girls Under 16 Comparison
Immigrants from Eastern Asia
Immigrants from Barbados
13.4%
CHILD POVERTY AMONG GIRLS UNDER 16
99.9/ 100
METRIC RATING
24th/ 347
METRIC RANK
19.9%
CHILD POVERTY AMONG GIRLS UNDER 16
0.1/ 100
METRIC RATING
271st/ 347
METRIC RANK
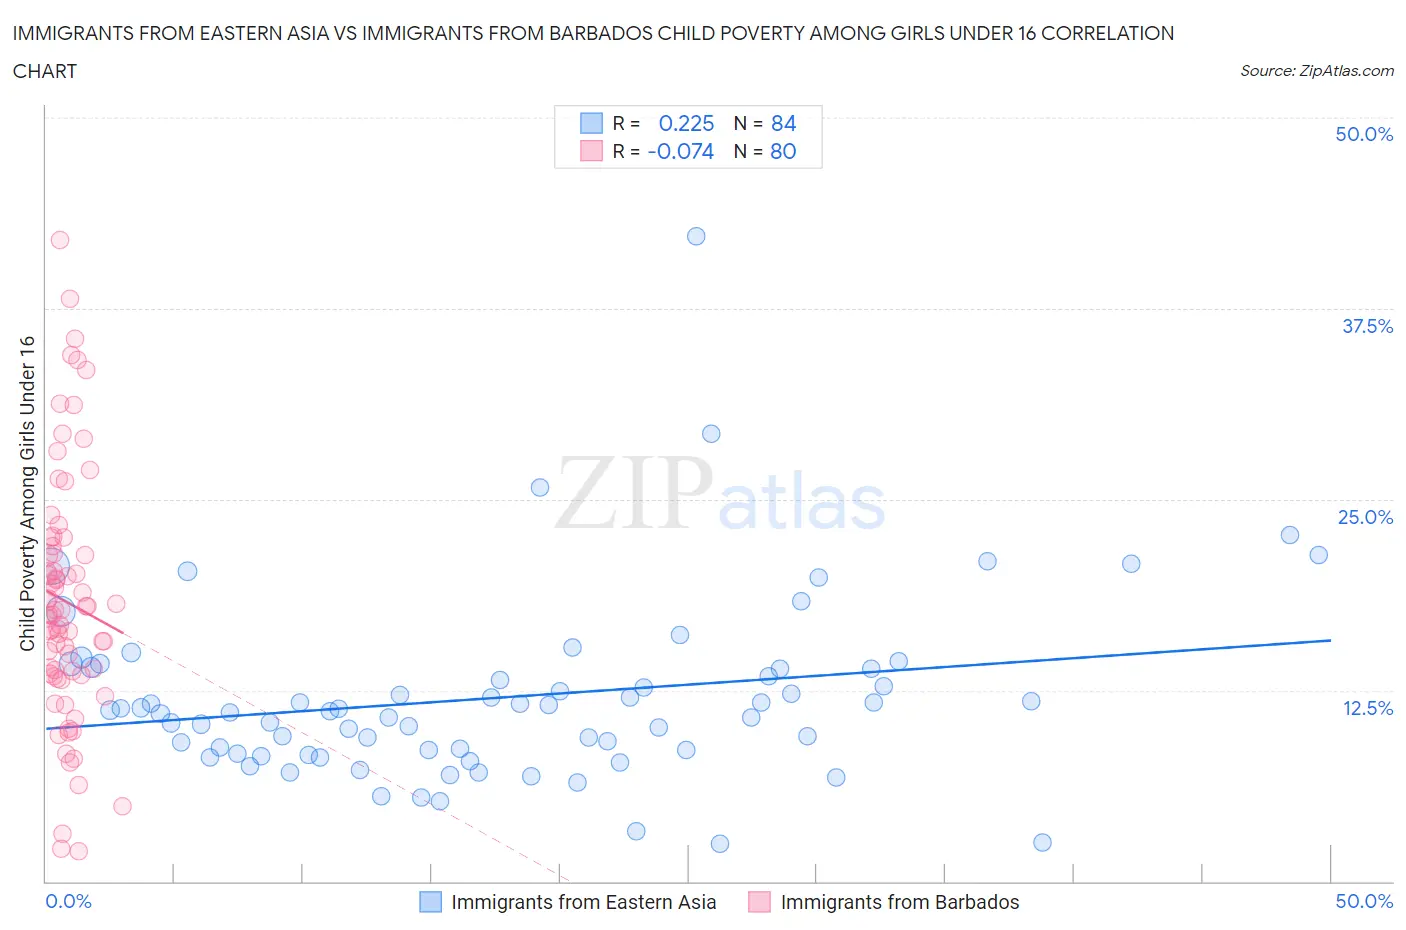
Immigrants from Eastern Asia vs Immigrants from Barbados Child Poverty Among Girls Under 16 Correlation Chart
The statistical analysis conducted on geographies consisting of 485,797,155 people shows a weak positive correlation between the proportion of Immigrants from Eastern Asia and poverty level among girls under the age of 16 in the United States with a correlation coefficient (R) of 0.225 and weighted average of 13.4%. Similarly, the statistical analysis conducted on geographies consisting of 112,076,716 people shows a slight negative correlation between the proportion of Immigrants from Barbados and poverty level among girls under the age of 16 in the United States with a correlation coefficient (R) of -0.074 and weighted average of 19.9%, a difference of 49.2%.
Child Poverty Among Girls Under 16 Correlation Summary
| Measurement | Immigrants from Eastern Asia | Immigrants from Barbados |
| Minimum | 2.5% | 2.0% |
| Maximum | 42.3% | 42.0% |
| Range | 39.8% | 40.0% |
| Mean | 12.0% | 18.3% |
| Median | 11.1% | 17.6% |
| Interquartile 25% (IQ1) | 8.5% | 13.5% |
| Interquartile 75% (IQ3) | 13.9% | 21.7% |
| Interquartile Range (IQR) | 5.5% | 8.2% |
| Standard Deviation (Sample) | 5.9% | 8.1% |
| Standard Deviation (Population) | 5.9% | 8.1% |
Similar Demographics by Child Poverty Among Girls Under 16
Demographics Similar to Immigrants from Eastern Asia by Child Poverty Among Girls Under 16
In terms of child poverty among girls under 16, the demographic groups most similar to Immigrants from Eastern Asia are Norwegian (13.3%, a difference of 0.090%), Indian (Asian) (13.3%, a difference of 0.26%), Assyrian/Chaldean/Syriac (13.3%, a difference of 0.46%), Immigrants from China (13.4%, a difference of 0.46%), and Immigrants from Japan (13.3%, a difference of 0.58%).
| Demographics | Rating | Rank | Child Poverty Among Girls Under 16 |
| Bulgarians | 99.9 /100 | #17 | Exceptional 13.1% |
| Immigrants | Korea | 99.9 /100 | #18 | Exceptional 13.1% |
| Cypriots | 99.9 /100 | #19 | Exceptional 13.2% |
| Immigrants | Japan | 99.9 /100 | #20 | Exceptional 13.3% |
| Assyrians/Chaldeans/Syriacs | 99.9 /100 | #21 | Exceptional 13.3% |
| Indians (Asian) | 99.9 /100 | #22 | Exceptional 13.3% |
| Norwegians | 99.9 /100 | #23 | Exceptional 13.3% |
| Immigrants | Eastern Asia | 99.9 /100 | #24 | Exceptional 13.4% |
| Immigrants | China | 99.8 /100 | #25 | Exceptional 13.4% |
| Eastern Europeans | 99.8 /100 | #26 | Exceptional 13.5% |
| Latvians | 99.8 /100 | #27 | Exceptional 13.5% |
| Tongans | 99.8 /100 | #28 | Exceptional 13.6% |
| Bolivians | 99.8 /100 | #29 | Exceptional 13.6% |
| Asians | 99.7 /100 | #30 | Exceptional 13.7% |
| Turks | 99.7 /100 | #31 | Exceptional 13.7% |
Demographics Similar to Immigrants from Barbados by Child Poverty Among Girls Under 16
In terms of child poverty among girls under 16, the demographic groups most similar to Immigrants from Barbados are Cherokee (19.9%, a difference of 0.10%), Immigrants from El Salvador (20.0%, a difference of 0.11%), Liberian (19.9%, a difference of 0.29%), Bangladeshi (20.0%, a difference of 0.31%), and Spanish American Indian (19.9%, a difference of 0.38%).
| Demographics | Rating | Rank | Child Poverty Among Girls Under 16 |
| Jamaicans | 0.1 /100 | #264 | Tragic 19.7% |
| Immigrants | Jamaica | 0.1 /100 | #265 | Tragic 19.8% |
| Spanish Americans | 0.1 /100 | #266 | Tragic 19.8% |
| Immigrants | Bangladesh | 0.1 /100 | #267 | Tragic 19.9% |
| Spanish American Indians | 0.1 /100 | #268 | Tragic 19.9% |
| Liberians | 0.1 /100 | #269 | Tragic 19.9% |
| Cherokee | 0.1 /100 | #270 | Tragic 19.9% |
| Immigrants | Barbados | 0.1 /100 | #271 | Tragic 19.9% |
| Immigrants | El Salvador | 0.1 /100 | #272 | Tragic 20.0% |
| Bangladeshis | 0.1 /100 | #273 | Tragic 20.0% |
| Immigrants | St. Vincent and the Grenadines | 0.0 /100 | #274 | Tragic 20.1% |
| Sub-Saharan Africans | 0.0 /100 | #275 | Tragic 20.1% |
| Comanche | 0.0 /100 | #276 | Tragic 20.2% |
| Belizeans | 0.0 /100 | #277 | Tragic 20.2% |
| Barbadians | 0.0 /100 | #278 | Tragic 20.2% |