Immigrants from Costa Rica vs Immigrants from Zimbabwe Child Poverty Among Boys Under 16
COMPARE
Immigrants from Costa Rica
Immigrants from Zimbabwe
Child Poverty Among Boys Under 16
Child Poverty Among Boys Under 16 Comparison
Immigrants from Costa Rica
Immigrants from Zimbabwe
16.7%
CHILD POVERTY AMONG BOYS UNDER 16
37.8/ 100
METRIC RATING
187th/ 347
METRIC RANK
15.2%
CHILD POVERTY AMONG BOYS UNDER 16
94.2/ 100
METRIC RATING
111th/ 347
METRIC RANK
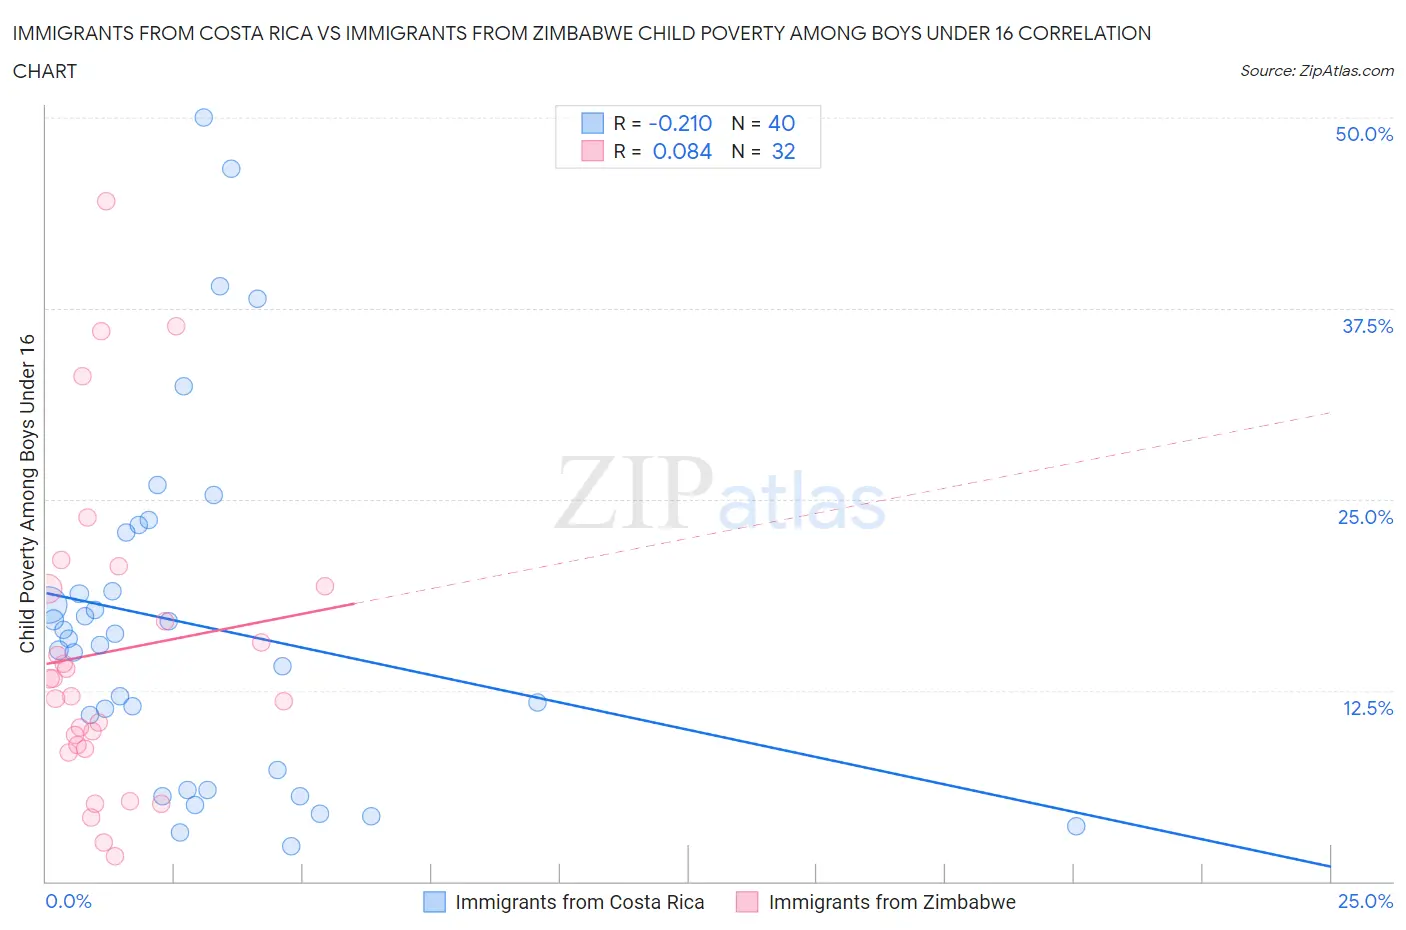
Immigrants from Costa Rica vs Immigrants from Zimbabwe Child Poverty Among Boys Under 16 Correlation Chart
The statistical analysis conducted on geographies consisting of 202,823,387 people shows a weak negative correlation between the proportion of Immigrants from Costa Rica and poverty level among boys under the age of 16 in the United States with a correlation coefficient (R) of -0.210 and weighted average of 16.7%. Similarly, the statistical analysis conducted on geographies consisting of 117,351,792 people shows a slight positive correlation between the proportion of Immigrants from Zimbabwe and poverty level among boys under the age of 16 in the United States with a correlation coefficient (R) of 0.084 and weighted average of 15.2%, a difference of 10.0%.
Child Poverty Among Boys Under 16 Correlation Summary
| Measurement | Immigrants from Costa Rica | Immigrants from Zimbabwe |
| Minimum | 2.3% | 1.6% |
| Maximum | 50.0% | 44.5% |
| Range | 47.7% | 42.9% |
| Mean | 16.8% | 15.0% |
| Median | 15.7% | 12.7% |
| Interquartile 25% (IQ1) | 6.6% | 8.8% |
| Interquartile 75% (IQ3) | 20.9% | 19.2% |
| Interquartile Range (IQR) | 14.3% | 10.4% |
| Standard Deviation (Sample) | 11.6% | 10.3% |
| Standard Deviation (Population) | 11.4% | 10.1% |
Similar Demographics by Child Poverty Among Boys Under 16
Demographics Similar to Immigrants from Costa Rica by Child Poverty Among Boys Under 16
In terms of child poverty among boys under 16, the demographic groups most similar to Immigrants from Costa Rica are Immigrants from South America (16.7%, a difference of 0.010%), Hmong (16.6%, a difference of 0.080%), Immigrants from Western Asia (16.6%, a difference of 0.30%), Celtic (16.6%, a difference of 0.33%), and Kenyan (16.6%, a difference of 0.37%).
| Demographics | Rating | Rank | Child Poverty Among Boys Under 16 |
| Hawaiians | 45.5 /100 | #180 | Average 16.5% |
| South American Indians | 44.3 /100 | #181 | Average 16.5% |
| Lebanese | 43.3 /100 | #182 | Average 16.6% |
| Kenyans | 41.0 /100 | #183 | Average 16.6% |
| Celtics | 40.6 /100 | #184 | Average 16.6% |
| Immigrants | Western Asia | 40.4 /100 | #185 | Average 16.6% |
| Hmong | 38.4 /100 | #186 | Fair 16.6% |
| Immigrants | Costa Rica | 37.8 /100 | #187 | Fair 16.7% |
| Immigrants | South America | 37.7 /100 | #188 | Fair 16.7% |
| Immigrants | Morocco | 34.5 /100 | #189 | Fair 16.7% |
| Arabs | 31.1 /100 | #190 | Fair 16.8% |
| Alaska Natives | 29.8 /100 | #191 | Fair 16.8% |
| Immigrants | Uganda | 21.6 /100 | #192 | Fair 17.0% |
| Immigrants | Iraq | 21.6 /100 | #193 | Fair 17.0% |
| Immigrants | Lebanon | 21.2 /100 | #194 | Fair 17.0% |
Demographics Similar to Immigrants from Zimbabwe by Child Poverty Among Boys Under 16
In terms of child poverty among boys under 16, the demographic groups most similar to Immigrants from Zimbabwe are English (15.1%, a difference of 0.050%), Basque (15.2%, a difference of 0.20%), Irish (15.2%, a difference of 0.24%), Immigrants from Ukraine (15.2%, a difference of 0.29%), and Pakistani (15.1%, a difference of 0.31%).
| Demographics | Rating | Rank | Child Poverty Among Boys Under 16 |
| Immigrants | Switzerland | 95.4 /100 | #104 | Exceptional 15.0% |
| Dutch | 95.4 /100 | #105 | Exceptional 15.0% |
| Serbians | 95.2 /100 | #106 | Exceptional 15.1% |
| Jordanians | 95.1 /100 | #107 | Exceptional 15.1% |
| Immigrants | England | 94.8 /100 | #108 | Exceptional 15.1% |
| Pakistanis | 94.7 /100 | #109 | Exceptional 15.1% |
| English | 94.3 /100 | #110 | Exceptional 15.1% |
| Immigrants | Zimbabwe | 94.2 /100 | #111 | Exceptional 15.2% |
| Basques | 93.8 /100 | #112 | Exceptional 15.2% |
| Irish | 93.8 /100 | #113 | Exceptional 15.2% |
| Immigrants | Ukraine | 93.6 /100 | #114 | Exceptional 15.2% |
| Armenians | 93.6 /100 | #115 | Exceptional 15.2% |
| Immigrants | South Eastern Asia | 93.5 /100 | #116 | Exceptional 15.2% |
| Immigrants | Vietnam | 93.5 /100 | #117 | Exceptional 15.2% |
| Native Hawaiians | 93.4 /100 | #118 | Exceptional 15.2% |