Immigrants from China vs Immigrants from Zimbabwe Child Poverty Among Boys Under 16

COMPARE

Immigrants from China
Race
Ancestry
AfghanAfricanAlaska NativeAlaskan AthabascanAlbanianAleutAlsatianAmericanApacheArabArapahoArgentineanArmenianAssyrian/Chaldean/SyriacAustralianAustrianBahamianBangladeshiBarbadianBasqueBelgianBelizeanBermudanBhutaneseBlackfeetBolivianBrazilianBritishBritish West IndianBulgarianBurmeseCajunCambodianCanadianCape VerdeanCarpatho RusynCelticCentral AmericanCentral American IndianCherokeeCheyenneChickasawChileanChineseChippewaChoctawColombianColvilleComancheCosta RicanCreeCreekCroatianCrowCubanCypriotCzechCzechoslovakianDanishDelawareDominicanDutchDutch West IndianEastern EuropeanEcuadorianEgyptianEnglishEstonianEthiopianEuropeanFijianFilipinoFinnishFrenchFrench American IndianFrench CanadianGermanGerman RussianGhanaianGreekGuamanian/ChamorroGuatemalanGuyaneseHaitianHmongHonduranHopiHoumaHungarianIcelanderIndian (Asian)IndonesianInupiatIranianIraqiIrishIroquoisIsraeliItalianJamaicanJapaneseJordanianKenyanKiowaKoreanLaotianLatvianLebaneseLiberianLithuanianLumbeeLuxembourgerMacedonianMalaysianMalteseMarshalleseMenomineeMexicanMexican American IndianMongolianMoroccanNative HawaiianNavajoNepaleseNew ZealanderNicaraguanNigerianNorthern EuropeanNorwegianOkinawanOsageOttawaPaiutePakistaniPalestinianPanamanianParaguayanPennsylvania GermanPeruvianPimaPolishPortuguesePotawatomiPuebloPuerto RicanPuget Sound SalishRomanianRussianSalvadoranSamoanScandinavianScotch-IrishScottishSeminoleSenegaleseSerbianShoshoneSierra LeoneanSiouxSlavicSlovakSloveneSomaliSouth AfricanSouth AmericanSouth American IndianSoviet UnionSpaniardSpanishSpanish AmericanSpanish American IndianSri LankanSubsaharan AfricanSudaneseSwedishSwissSyrianTaiwaneseThaiTlingit-HaidaTohono O'OdhamTonganTrinidadian and TobagonianTsimshianTurkishU.S. Virgin IslanderUgandanUkrainianUruguayanUteVenezuelanVietnameseWelshWest IndianYakamaYaquiYugoslavianYumanYup'ikZimbabwean
Immigration
NonimmigrantsImmigrantsAfghanistanAfricaAlbaniaArgentinaArmeniaAsiaAustraliaAustriaBahamasBangladeshBarbadosBelarusBelgiumBelizeBoliviaBosnia and HerzegovinaBrazilBulgariaBurma/MyanmarCabo VerdeCambodiaCameroonCanadaCaribbeanCentral AmericaChileChinaColombiaCongoCosta RicaCroatiaCubaCzechoslovakiaDenmarkDominicaDominican RepublicEastern AfricaEastern AsiaEastern EuropeEcuadorEgyptEl SalvadorEnglandEritreaEthiopiaEuropeFijiFranceGermanyGhanaGreeceGrenadaGuatemalaGuyanaHaitiHondurasHong KongHungaryIndiaIndonesiaIranIraqIrelandIsraelItalyJamaicaJapanJordanKazakhstanKenyaKoreaKuwaitLaosLatin AmericaLatviaLebanonLiberiaLithuaniaMalaysiaMexicoMicronesiaMiddle AfricaMoldovaMoroccoNepalNetherlandsNicaraguaNigeriaNorth AmericaNorth MacedoniaNorthern AfricaNorthern EuropeNorwayOceaniaPakistanPanamaPeruPhilippinesPolandPortugalRomaniaRussiaSaudi ArabiaScotlandSenegalSerbiaSierra LeoneSingaporeSomaliaSouth AfricaSouth AmericaSouth Central AsiaSouth Eastern AsiaSouthern EuropeSpainSri LankaSt. Vincent and the GrenadinesSudanSwedenSwitzerlandSyriaTaiwanThailandTrinidad and TobagoTurkeyUgandaUkraineUruguayUzbekistanVenezuelaVietnamWest IndiesWestern AfricaWestern AsiaWestern EuropeYemenZaireAzores
Immigrants from Zimbabwe
Race
Ancestry
AfghanAfricanAlaska NativeAlaskan AthabascanAlbanianAleutAlsatianAmericanApacheArabArapahoArgentineanArmenianAssyrian/Chaldean/SyriacAustralianAustrianBahamianBangladeshiBarbadianBasqueBelgianBelizeanBermudanBhutaneseBlackfeetBolivianBrazilianBritishBritish West IndianBulgarianBurmeseCajunCambodianCanadianCape VerdeanCarpatho RusynCelticCentral AmericanCentral American IndianCherokeeCheyenneChickasawChileanChineseChippewaChoctawColombianColvilleComancheCosta RicanCreeCreekCroatianCrowCubanCypriotCzechCzechoslovakianDanishDelawareDominicanDutchDutch West IndianEastern EuropeanEcuadorianEgyptianEnglishEstonianEthiopianEuropeanFijianFilipinoFinnishFrenchFrench American IndianFrench CanadianGermanGerman RussianGhanaianGreekGuamanian/ChamorroGuatemalanGuyaneseHaitianHmongHonduranHopiHoumaHungarianIcelanderIndian (Asian)IndonesianInupiatIranianIraqiIrishIroquoisIsraeliItalianJamaicanJapaneseJordanianKenyanKiowaKoreanLaotianLatvianLebaneseLiberianLithuanianLumbeeLuxembourgerMacedonianMalaysianMalteseMarshalleseMenomineeMexicanMexican American IndianMongolianMoroccanNative HawaiianNavajoNepaleseNew ZealanderNicaraguanNigerianNorthern EuropeanNorwegianOkinawanOsageOttawaPaiutePakistaniPalestinianPanamanianParaguayanPennsylvania GermanPeruvianPimaPolishPortuguesePotawatomiPuebloPuerto RicanPuget Sound SalishRomanianRussianSalvadoranSamoanScandinavianScotch-IrishScottishSeminoleSenegaleseSerbianShoshoneSierra LeoneanSiouxSlavicSlovakSloveneSomaliSouth AfricanSouth AmericanSouth American IndianSoviet UnionSpaniardSpanishSpanish AmericanSpanish American IndianSri LankanSubsaharan AfricanSudaneseSwedishSwissSyrianTaiwaneseThaiTlingit-HaidaTohono O'OdhamTonganTrinidadian and TobagonianTsimshianTurkishU.S. Virgin IslanderUgandanUkrainianUruguayanUteVenezuelanVietnameseWelshWest IndianYakamaYaquiYugoslavianYumanYup'ikZimbabwean
Immigration
NonimmigrantsImmigrantsAfghanistanAfricaAlbaniaArgentinaArmeniaAsiaAustraliaAustriaBahamasBangladeshBarbadosBelarusBelgiumBelizeBoliviaBosnia and HerzegovinaBrazilBulgariaBurma/MyanmarCabo VerdeCambodiaCameroonCanadaCaribbeanCentral AmericaChileColombiaCongoCosta RicaCroatiaCubaCzechoslovakiaDenmarkDominicaDominican RepublicEastern AfricaEastern AsiaEastern EuropeEcuadorEgyptEl SalvadorEnglandEritreaEthiopiaEuropeFijiFranceGermanyGhanaGreeceGrenadaGuatemalaGuyanaHaitiHondurasHong KongHungaryIndiaIndonesiaIranIraqIrelandIsraelItalyJamaicaJapanJordanKazakhstanKenyaKoreaKuwaitLaosLatin AmericaLatviaLebanonLiberiaLithuaniaMalaysiaMexicoMicronesiaMiddle AfricaMoldovaMoroccoNepalNetherlandsNicaraguaNigeriaNorth AmericaNorth MacedoniaNorthern AfricaNorthern EuropeNorwayOceaniaPakistanPanamaPeruPhilippinesPolandPortugalRomaniaRussiaSaudi ArabiaScotlandSenegalSerbiaSierra LeoneSingaporeSomaliaSouth AfricaSouth AmericaSouth Central AsiaSouth Eastern AsiaSouthern EuropeSpainSri LankaSt. Vincent and the GrenadinesSudanSwedenSwitzerlandSyriaTaiwanThailandTrinidad and TobagoTurkeyUgandaUkraineUruguayUzbekistanVenezuelaVietnamWest IndiesWestern AfricaWestern AsiaWestern EuropeYemenZaireZimbabweAzores
Child Poverty Among Boys Under 16
Income
Poverty
Unemployment
Labor Participation
Family Structure
Vehicle Availability
Education Level
Disability

Child Poverty Among Boys Under 16 Comparison

Immigrants from China

Immigrants from Zimbabwe

Exceptional
Exceptional
13.6%
CHILD POVERTY AMONG BOYS UNDER 16
99.8/ 100
METRIC RATING
32nd/ 347
METRIC RANK
15.2%
CHILD POVERTY AMONG BOYS UNDER 16
94.2/ 100
METRIC RATING
111th/ 347
METRIC RANK

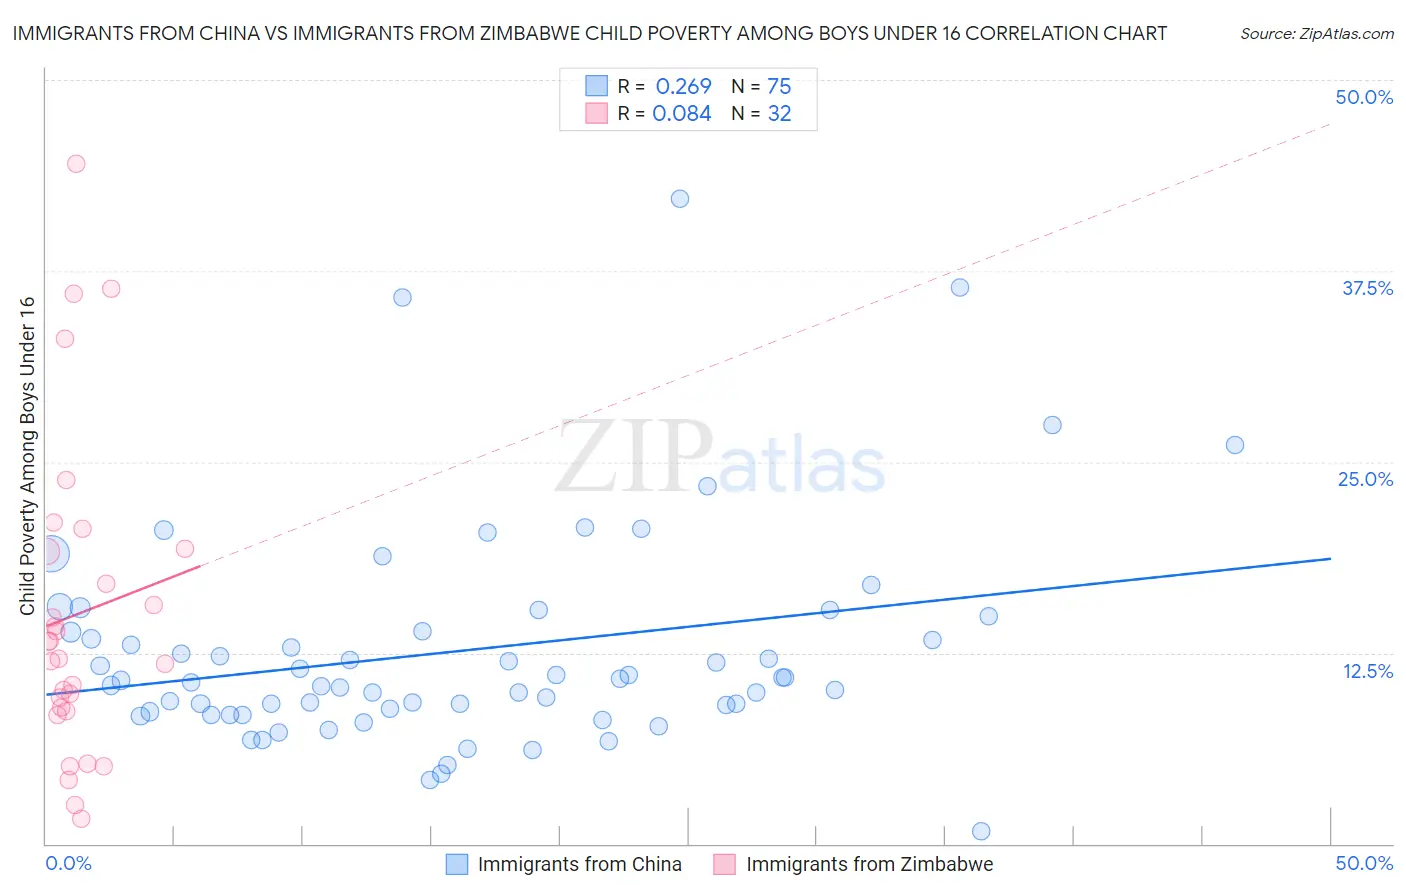
Immigrants from China vs Immigrants from Zimbabwe Child Poverty Among Boys Under 16 Correlation Chart

The statistical analysis conducted on geographies consisting of 446,614,379 people shows a weak positive correlation between the proportion of Immigrants from China and poverty level among boys under the age of 16 in the United States with a correlation coefficient (R) of 0.269 and weighted average of 13.6%. Similarly, the statistical analysis conducted on geographies consisting of 117,351,792 people shows a slight positive correlation between the proportion of Immigrants from Zimbabwe and poverty level among boys under the age of 16 in the United States with a correlation coefficient (R) of 0.084 and weighted average of 15.2%, a difference of 11.5%.
Immigrants from China vs Immigrants from Zimbabwe Child Poverty Among Boys Under 16

Child Poverty Among Boys Under 16 Correlation Summary

MeasurementImmigrants from ChinaImmigrants from Zimbabwe
Minimum0.83%1.6%
Maximum42.3%44.5%
Range41.4%42.9%
Mean12.6%15.0%
Median10.7%12.7%
Interquartile 25% (IQ1)8.6%8.8%
Interquartile 75% (IQ3)13.9%19.2%
Interquartile Range (IQR)5.3%10.4%
Standard Deviation (Sample)7.2%10.3%
Standard Deviation (Population)7.1%10.1%

Similar Demographics by Child Poverty Among Boys Under 16

Demographics Similar to Immigrants from China by Child Poverty Among Boys Under 16

In terms of child poverty among boys under 16, the demographic groups most similar to Immigrants from China are Turkish (13.6%, a difference of 0.090%), Swedish (13.6%, a difference of 0.17%), Danish (13.6%, a difference of 0.18%), Cypriot (13.6%, a difference of 0.27%), and Assyrian/Chaldean/Syriac (13.6%, a difference of 0.29%).
DemographicsRating | RankChild Poverty Among Boys Under 16
Okinawans
99.8
/100
|
#25
Exceptional
13.5%
Immigrants | Bolivia
99.8
/100
|
#26
Exceptional
13.5%
Asians
99.8
/100
|
#27
Exceptional
13.5%
Eastern Europeans
99.8
/100
|
#28
Exceptional
13.5%
Cypriots
99.8
/100
|
#29
Exceptional
13.6%
Swedes
99.8
/100
|
#30
Exceptional
13.6%
Turks
99.8
/100
|
#31
Exceptional
13.6%
Immigrants | China
99.8
/100
|
#32
Exceptional
13.6%
Danes
99.8
/100
|
#33
Exceptional
13.6%
Assyrians/Chaldeans/Syriacs
99.8
/100
|
#34
Exceptional
13.6%
Russians
99.7
/100
|
#35
Exceptional
13.8%
Luxembourgers
99.7
/100
|
#36
Exceptional
13.8%
Immigrants | Sri Lanka
99.6
/100
|
#37
Exceptional
13.9%
Immigrants | Northern Europe
99.6
/100
|
#38
Exceptional
13.9%
Immigrants | Australia
99.6
/100
|
#39
Exceptional
13.9%

Demographics Similar to Immigrants from Zimbabwe by Child Poverty Among Boys Under 16

In terms of child poverty among boys under 16, the demographic groups most similar to Immigrants from Zimbabwe are English (15.1%, a difference of 0.050%), Basque (15.2%, a difference of 0.20%), Irish (15.2%, a difference of 0.24%), Immigrants from Ukraine (15.2%, a difference of 0.29%), and Pakistani (15.1%, a difference of 0.31%).
DemographicsRating | RankChild Poverty Among Boys Under 16
Immigrants | Switzerland
95.4
/100
|
#104
Exceptional
15.0%
Dutch
95.4
/100
|
#105
Exceptional
15.0%
Serbians
95.2
/100
|
#106
Exceptional
15.1%
Jordanians
95.1
/100
|
#107
Exceptional
15.1%
Immigrants | England
94.8
/100
|
#108
Exceptional
15.1%
Pakistanis
94.7
/100
|
#109
Exceptional
15.1%
English
94.3
/100
|
#110
Exceptional
15.1%
Immigrants | Zimbabwe
94.2
/100
|
#111
Exceptional
15.2%
Basques
93.8
/100
|
#112
Exceptional
15.2%
Irish
93.8
/100
|
#113
Exceptional
15.2%
Immigrants | Ukraine
93.6
/100
|
#114
Exceptional
15.2%
Armenians
93.6
/100
|
#115
Exceptional
15.2%
Immigrants | South Eastern Asia
93.5
/100
|
#116
Exceptional
15.2%
Immigrants | Vietnam
93.5
/100
|
#117
Exceptional
15.2%
Native Hawaiians
93.4
/100
|
#118
Exceptional
15.2%