Immigrants from Cameroon vs German Russian Seniors Poverty Over the Age of 75

COMPARE

Immigrants from Cameroon
Race
Ancestry
AfghanAfricanAlaska NativeAlaskan AthabascanAlbanianAleutAlsatianAmericanApacheArabArapahoArgentineanArmenianAssyrian/Chaldean/SyriacAustralianAustrianBahamianBangladeshiBarbadianBasqueBelgianBelizeanBermudanBhutaneseBlackfeetBolivianBrazilianBritishBritish West IndianBulgarianBurmeseCajunCambodianCanadianCape VerdeanCarpatho RusynCelticCentral AmericanCentral American IndianCherokeeCheyenneChickasawChileanChineseChippewaChoctawColombianColvilleComancheCosta RicanCreeCreekCroatianCrowCubanCypriotCzechCzechoslovakianDanishDelawareDominicanDutchDutch West IndianEastern EuropeanEcuadorianEgyptianEnglishEstonianEthiopianEuropeanFijianFilipinoFinnishFrenchFrench American IndianFrench CanadianGermanGhanaianGreekGuamanian/ChamorroGuatemalanGuyaneseHaitianHmongHonduranHopiHoumaHungarianIcelanderIndian (Asian)IndonesianInupiatIranianIraqiIrishIroquoisIsraeliItalianJamaicanJapaneseJordanianKenyanKiowaKoreanLaotianLatvianLebaneseLiberianLithuanianLumbeeLuxembourgerMacedonianMalaysianMalteseMarshalleseMenomineeMexicanMexican American IndianMongolianMoroccanNative HawaiianNavajoNepaleseNew ZealanderNicaraguanNigerianNorthern EuropeanNorwegianOkinawanOsageOttawaPaiutePakistaniPalestinianPanamanianParaguayanPennsylvania GermanPeruvianPimaPolishPortuguesePotawatomiPuebloPuerto RicanPuget Sound SalishRomanianRussianSalvadoranSamoanScandinavianScotch-IrishScottishSeminoleSenegaleseSerbianShoshoneSierra LeoneanSiouxSlavicSlovakSloveneSomaliSouth AfricanSouth AmericanSouth American IndianSoviet UnionSpaniardSpanishSpanish AmericanSpanish American IndianSri LankanSubsaharan AfricanSudaneseSwedishSwissSyrianTaiwaneseThaiTlingit-HaidaTohono O'OdhamTonganTrinidadian and TobagonianTsimshianTurkishU.S. Virgin IslanderUgandanUkrainianUruguayanUteVenezuelanVietnameseWelshWest IndianYakamaYaquiYugoslavianYumanYup'ikZimbabwean
Immigration
NonimmigrantsImmigrantsAfghanistanAfricaAlbaniaArgentinaArmeniaAsiaAustraliaAustriaBahamasBangladeshBarbadosBelarusBelgiumBelizeBoliviaBosnia and HerzegovinaBrazilBulgariaBurma/MyanmarCabo VerdeCambodiaCameroonCanadaCaribbeanCentral AmericaChileChinaColombiaCongoCosta RicaCroatiaCubaCzechoslovakiaDenmarkDominicaDominican RepublicEastern AfricaEastern AsiaEastern EuropeEcuadorEgyptEl SalvadorEnglandEritreaEthiopiaEuropeFijiFranceGermanyGhanaGreeceGrenadaGuatemalaGuyanaHaitiHondurasHong KongHungaryIndiaIndonesiaIranIraqIrelandIsraelItalyJamaicaJapanJordanKazakhstanKenyaKoreaKuwaitLaosLatin AmericaLatviaLebanonLiberiaLithuaniaMalaysiaMexicoMicronesiaMiddle AfricaMoldovaMoroccoNepalNetherlandsNicaraguaNigeriaNorth AmericaNorth MacedoniaNorthern AfricaNorthern EuropeNorwayOceaniaPakistanPanamaPeruPhilippinesPolandPortugalRomaniaRussiaSaudi ArabiaScotlandSenegalSerbiaSierra LeoneSingaporeSomaliaSouth AfricaSouth AmericaSouth Central AsiaSouth Eastern AsiaSouthern EuropeSpainSri LankaSt. Vincent and the GrenadinesSudanSwedenSwitzerlandSyriaTaiwanThailandTrinidad and TobagoTurkeyUgandaUkraineUruguayUzbekistanVenezuelaVietnamWest IndiesWestern AfricaWestern AsiaWestern EuropeYemenZaireZimbabweAzores
German Russian
Race
Ancestry
AfghanAfricanAlaska NativeAlaskan AthabascanAlbanianAleutAlsatianAmericanApacheArabArapahoArgentineanArmenianAssyrian/Chaldean/SyriacAustralianAustrianBahamianBangladeshiBarbadianBasqueBelgianBelizeanBermudanBhutaneseBlackfeetBolivianBrazilianBritishBritish West IndianBulgarianBurmeseCajunCambodianCanadianCape VerdeanCarpatho RusynCelticCentral AmericanCentral American IndianCherokeeCheyenneChickasawChileanChineseChippewaChoctawColombianColvilleComancheCosta RicanCreeCreekCroatianCrowCubanCypriotCzechCzechoslovakianDanishDelawareDominicanDutchDutch West IndianEastern EuropeanEcuadorianEgyptianEnglishEstonianEthiopianEuropeanFijianFilipinoFinnishFrenchFrench American IndianFrench CanadianGermanGerman RussianGhanaianGreekGuamanian/ChamorroGuatemalanGuyaneseHaitianHmongHonduranHopiHoumaHungarianIcelanderIndian (Asian)IndonesianInupiatIranianIraqiIrishIroquoisIsraeliItalianJamaicanJapaneseJordanianKenyanKiowaKoreanLaotianLatvianLebaneseLiberianLithuanianLumbeeLuxembourgerMacedonianMalaysianMalteseMarshalleseMenomineeMexicanMexican American IndianMongolianMoroccanNative HawaiianNavajoNepaleseNew ZealanderNicaraguanNigerianNorthern EuropeanNorwegianOkinawanOsageOttawaPaiutePakistaniPalestinianPanamanianParaguayanPennsylvania GermanPeruvianPimaPolishPortuguesePotawatomiPuebloPuerto RicanPuget Sound SalishRomanianRussianSalvadoranSamoanScandinavianScotch-IrishScottishSeminoleSenegaleseSerbianShoshoneSierra LeoneanSiouxSlavicSlovakSloveneSomaliSouth AfricanSouth AmericanSouth American IndianSoviet UnionSpaniardSpanishSpanish AmericanSpanish American IndianSri LankanSubsaharan AfricanSudaneseSwedishSwissSyrianTaiwaneseThaiTlingit-HaidaTohono O'OdhamTonganTrinidadian and TobagonianTsimshianTurkishU.S. Virgin IslanderUgandanUkrainianUruguayanUteVenezuelanVietnameseWelshWest IndianYakamaYaquiYugoslavianYumanYup'ikZimbabwean
Immigration
NonimmigrantsImmigrantsAfghanistanAfricaAlbaniaArgentinaArmeniaAsiaAustraliaAustriaBahamasBangladeshBarbadosBelarusBelgiumBelizeBoliviaBosnia and HerzegovinaBrazilBulgariaBurma/MyanmarCabo VerdeCambodiaCanadaCaribbeanCentral AmericaChileChinaColombiaCongoCosta RicaCroatiaCubaCzechoslovakiaDenmarkDominicaDominican RepublicEastern AfricaEastern AsiaEastern EuropeEcuadorEgyptEl SalvadorEnglandEritreaEthiopiaEuropeFijiFranceGermanyGhanaGreeceGrenadaGuatemalaGuyanaHaitiHondurasHong KongHungaryIndiaIndonesiaIranIraqIrelandIsraelItalyJamaicaJapanJordanKazakhstanKenyaKoreaKuwaitLaosLatin AmericaLatviaLebanonLiberiaLithuaniaMalaysiaMexicoMicronesiaMiddle AfricaMoldovaMoroccoNepalNetherlandsNicaraguaNigeriaNorth AmericaNorth MacedoniaNorthern AfricaNorthern EuropeNorwayOceaniaPakistanPanamaPeruPhilippinesPolandPortugalRomaniaRussiaSaudi ArabiaScotlandSenegalSerbiaSierra LeoneSingaporeSomaliaSouth AfricaSouth AmericaSouth Central AsiaSouth Eastern AsiaSouthern EuropeSpainSri LankaSt. Vincent and the GrenadinesSudanSwedenSwitzerlandSyriaTaiwanThailandTrinidad and TobagoTurkeyUgandaUkraineUruguayUzbekistanVenezuelaVietnamWest IndiesWestern AfricaWestern AsiaWestern EuropeYemenZaireZimbabweAzores
Seniors Poverty Over the Age of 75
Income
Poverty
Unemployment
Labor Participation
Family Structure
Vehicle Availability
Education Level
Disability

Seniors Poverty Over the Age of 75 Comparison

Immigrants from Cameroon

German Russians

Good
Average
12.0%
SENIORS POVERTY OVER THE AGE OF 75
71.7/ 100
METRIC RATING
141st/ 347
METRIC RANK
12.3%
SENIORS POVERTY OVER THE AGE OF 75
41.4/ 100
METRIC RATING
182nd/ 347
METRIC RANK

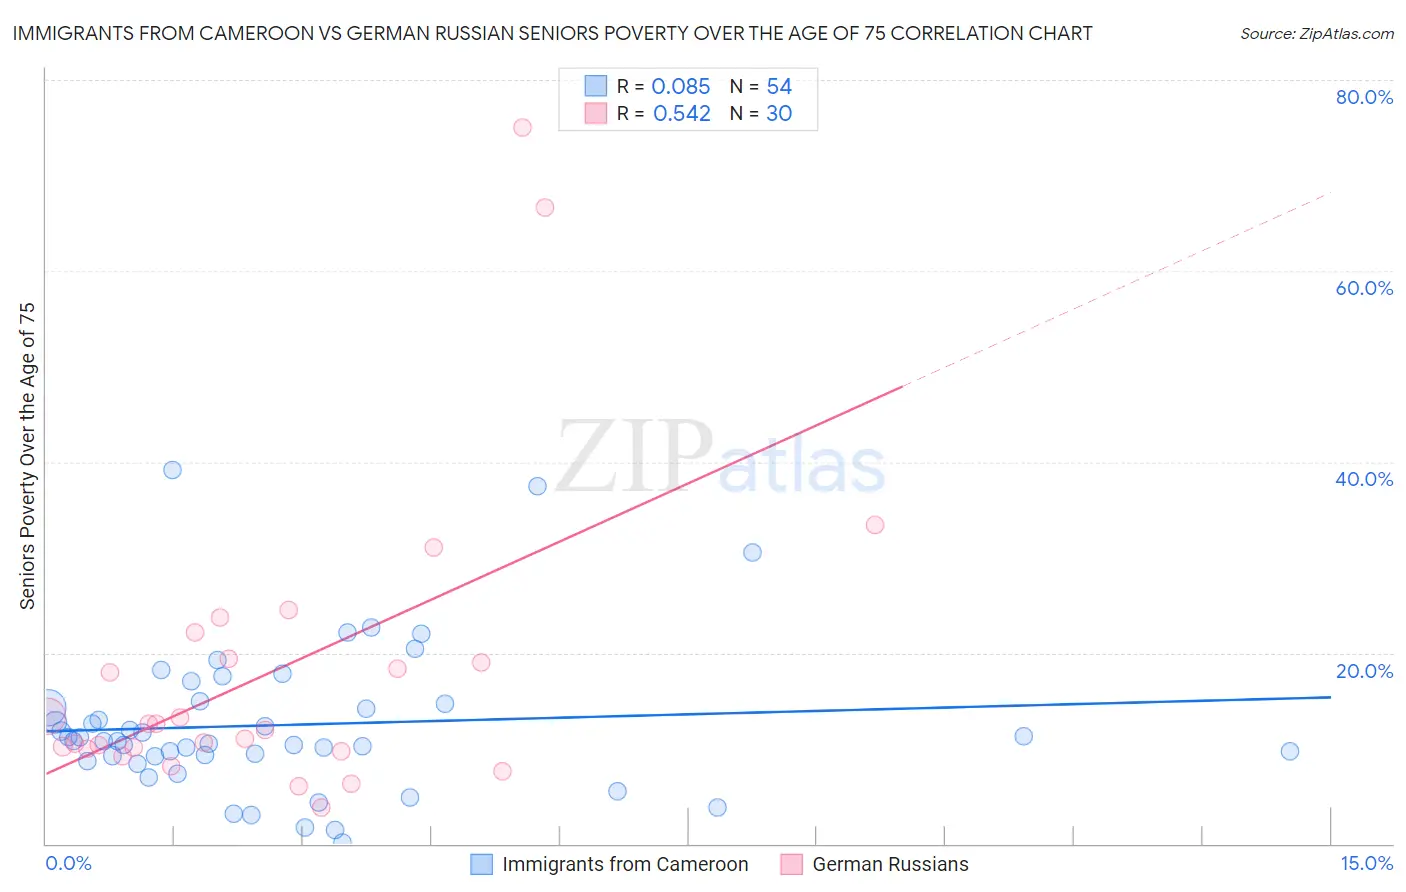
Immigrants from Cameroon vs German Russian Seniors Poverty Over the Age of 75 Correlation Chart

The statistical analysis conducted on geographies consisting of 130,036,589 people shows a slight positive correlation between the proportion of Immigrants from Cameroon and poverty level among seniors over the age of 75 in the United States with a correlation coefficient (R) of 0.085 and weighted average of 12.0%. Similarly, the statistical analysis conducted on geographies consisting of 96,005,724 people shows a substantial positive correlation between the proportion of German Russians and poverty level among seniors over the age of 75 in the United States with a correlation coefficient (R) of 0.542 and weighted average of 12.3%, a difference of 2.6%.
Immigrants from Cameroon vs German Russian Seniors Poverty Over the Age of 75

Seniors Poverty Over the Age of 75 Correlation Summary

MeasurementImmigrants from CameroonGerman Russian
Minimum0.14%3.8%
Maximum39.1%75.0%
Range38.9%71.2%
Mean12.4%17.9%
Median10.7%12.2%
Interquartile 25% (IQ1)9.2%9.9%
Interquartile 75% (IQ3)14.6%19.4%
Interquartile Range (IQR)5.4%9.5%
Standard Deviation (Sample)7.8%16.1%
Standard Deviation (Population)7.7%15.8%

Similar Demographics by Seniors Poverty Over the Age of 75

Demographics Similar to Immigrants from Cameroon by Seniors Poverty Over the Age of 75

In terms of seniors poverty over the age of 75, the demographic groups most similar to Immigrants from Cameroon are Immigrants from Pakistan (12.0%, a difference of 0.020%), Immigrants from Laos (12.0%, a difference of 0.030%), Immigrants from Kenya (11.9%, a difference of 0.080%), American (12.0%, a difference of 0.080%), and Immigrants from Romania (11.9%, a difference of 0.090%).
DemographicsRating | RankSeniors Poverty Over the Age of 75
Ugandans
77.1
/100
|
#134
Good
11.9%
Immigrants | Ireland
76.2
/100
|
#135
Good
11.9%
Immigrants | Philippines
75.0
/100
|
#136
Good
11.9%
Immigrants | Moldova
74.1
/100
|
#137
Good
11.9%
Immigrants | Romania
72.6
/100
|
#138
Good
11.9%
Immigrants | Kenya
72.6
/100
|
#139
Good
11.9%
Immigrants | Pakistan
71.9
/100
|
#140
Good
12.0%
Immigrants | Cameroon
71.7
/100
|
#141
Good
12.0%
Immigrants | Laos
71.5
/100
|
#142
Good
12.0%
Americans
71.0
/100
|
#143
Good
12.0%
Hmong
70.8
/100
|
#144
Good
12.0%
Immigrants | Belgium
70.8
/100
|
#145
Good
12.0%
Bangladeshis
70.4
/100
|
#146
Good
12.0%
Immigrants | Latvia
69.1
/100
|
#147
Good
12.0%
Immigrants | Zaire
67.6
/100
|
#148
Good
12.0%

Demographics Similar to German Russians by Seniors Poverty Over the Age of 75

In terms of seniors poverty over the age of 75, the demographic groups most similar to German Russians are Immigrants from Australia (12.2%, a difference of 0.23%), Immigrants from South Eastern Asia (12.2%, a difference of 0.24%), Laotian (12.3%, a difference of 0.27%), Mongolian (12.2%, a difference of 0.34%), and Nonimmigrants (12.2%, a difference of 0.45%).
DemographicsRating | RankSeniors Poverty Over the Age of 75
Immigrants | Saudi Arabia
49.5
/100
|
#175
Average
12.2%
Immigrants | Iran
48.1
/100
|
#176
Average
12.2%
Immigrants | Asia
47.8
/100
|
#177
Average
12.2%
Immigrants | Nonimmigrants
46.8
/100
|
#178
Average
12.2%
Mongolians
45.5
/100
|
#179
Average
12.2%
Immigrants | South Eastern Asia
44.3
/100
|
#180
Average
12.2%
Immigrants | Australia
44.2
/100
|
#181
Average
12.2%
German Russians
41.4
/100
|
#182
Average
12.3%
Laotians
38.2
/100
|
#183
Fair
12.3%
Kiowa
36.0
/100
|
#184
Fair
12.3%
Immigrants | Malaysia
35.8
/100
|
#185
Fair
12.3%
Sri Lankans
32.3
/100
|
#186
Fair
12.4%
Yaqui
25.9
/100
|
#187
Fair
12.5%
Immigrants | Northern Africa
25.2
/100
|
#188
Fair
12.5%
Immigrants | Indonesia
24.4
/100
|
#189
Fair
12.5%