Bhutanese vs German Russian Seniors Poverty Over the Age of 75
COMPARE
Bhutanese
German Russian
Seniors Poverty Over the Age of 75
Seniors Poverty Over the Age of 75 Comparison
Bhutanese
German Russians
10.6%
SENIORS POVERTY OVER THE AGE OF 75
99.8/ 100
METRIC RATING
22nd/ 347
METRIC RANK
12.3%
SENIORS POVERTY OVER THE AGE OF 75
41.4/ 100
METRIC RATING
182nd/ 347
METRIC RANK
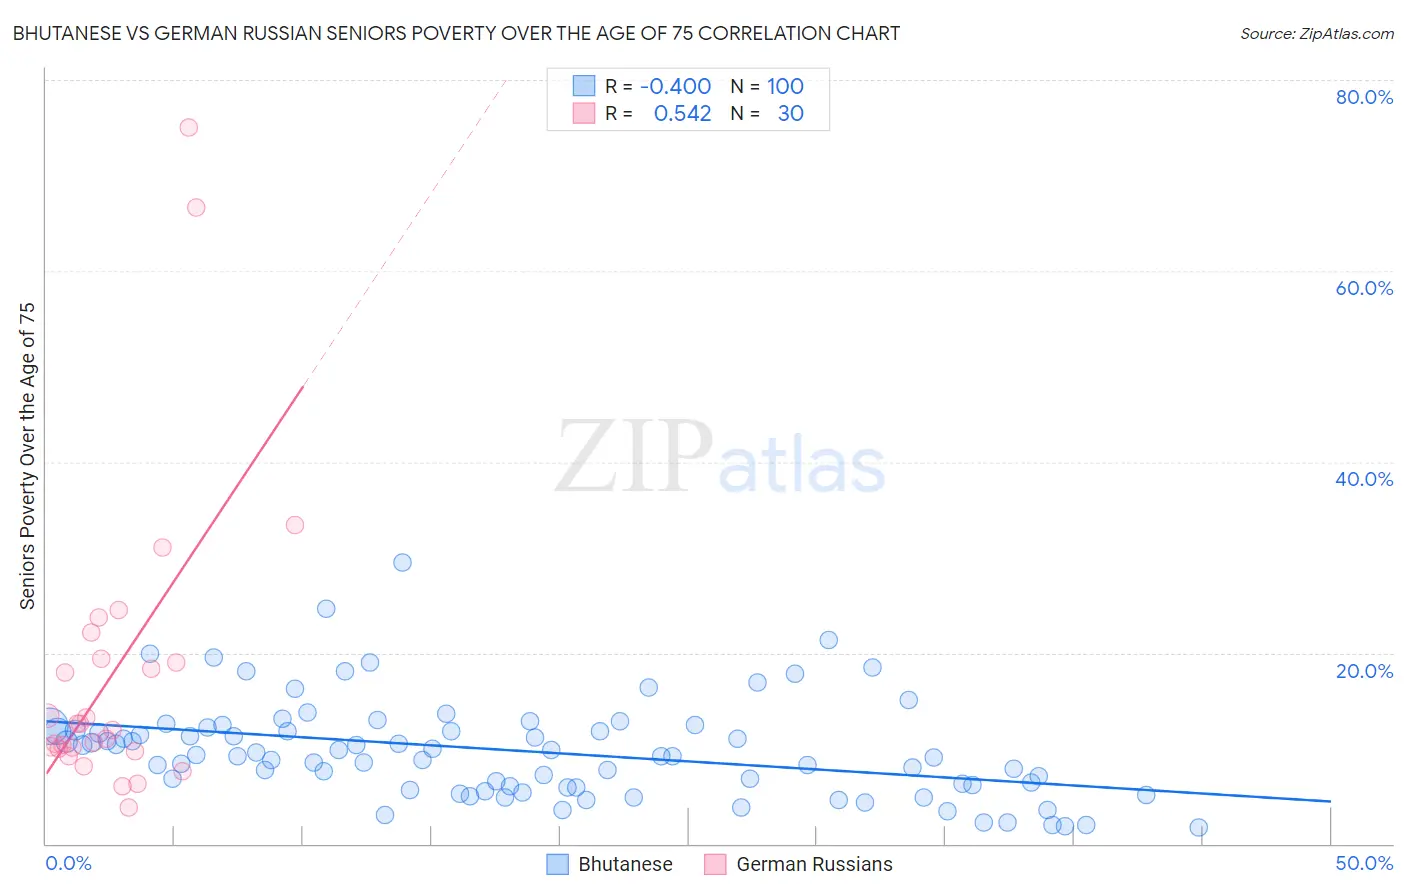
Bhutanese vs German Russian Seniors Poverty Over the Age of 75 Correlation Chart
The statistical analysis conducted on geographies consisting of 448,170,245 people shows a mild negative correlation between the proportion of Bhutanese and poverty level among seniors over the age of 75 in the United States with a correlation coefficient (R) of -0.400 and weighted average of 10.6%. Similarly, the statistical analysis conducted on geographies consisting of 96,005,724 people shows a substantial positive correlation between the proportion of German Russians and poverty level among seniors over the age of 75 in the United States with a correlation coefficient (R) of 0.542 and weighted average of 12.3%, a difference of 16.0%.
Seniors Poverty Over the Age of 75 Correlation Summary
| Measurement | Bhutanese | German Russian |
| Minimum | 1.7% | 3.8% |
| Maximum | 29.4% | 75.0% |
| Range | 27.7% | 71.2% |
| Mean | 9.8% | 17.9% |
| Median | 9.2% | 12.2% |
| Interquartile 25% (IQ1) | 6.0% | 9.9% |
| Interquartile 75% (IQ3) | 12.1% | 19.4% |
| Interquartile Range (IQR) | 6.1% | 9.5% |
| Standard Deviation (Sample) | 5.1% | 16.1% |
| Standard Deviation (Population) | 5.1% | 15.8% |
Similar Demographics by Seniors Poverty Over the Age of 75
Demographics Similar to Bhutanese by Seniors Poverty Over the Age of 75
In terms of seniors poverty over the age of 75, the demographic groups most similar to Bhutanese are Lithuanian (10.6%, a difference of 0.020%), Polish (10.6%, a difference of 0.090%), Menominee (10.6%, a difference of 0.11%), Slovene (10.6%, a difference of 0.26%), and Czech (10.5%, a difference of 0.30%).
| Demographics | Rating | Rank | Seniors Poverty Over the Age of 75 |
| Europeans | 99.9 /100 | #15 | Exceptional 10.5% |
| Dutch | 99.9 /100 | #16 | Exceptional 10.5% |
| Slovaks | 99.9 /100 | #17 | Exceptional 10.5% |
| Welsh | 99.9 /100 | #18 | Exceptional 10.5% |
| Immigrants | Scotland | 99.9 /100 | #19 | Exceptional 10.5% |
| Czechs | 99.9 /100 | #20 | Exceptional 10.5% |
| Slovenes | 99.9 /100 | #21 | Exceptional 10.6% |
| Bhutanese | 99.8 /100 | #22 | Exceptional 10.6% |
| Lithuanians | 99.8 /100 | #23 | Exceptional 10.6% |
| Poles | 99.8 /100 | #24 | Exceptional 10.6% |
| Menominee | 99.8 /100 | #25 | Exceptional 10.6% |
| Bulgarians | 99.8 /100 | #26 | Exceptional 10.7% |
| Northern Europeans | 99.8 /100 | #27 | Exceptional 10.7% |
| Irish | 99.8 /100 | #28 | Exceptional 10.7% |
| Assyrians/Chaldeans/Syriacs | 99.8 /100 | #29 | Exceptional 10.7% |
Demographics Similar to German Russians by Seniors Poverty Over the Age of 75
In terms of seniors poverty over the age of 75, the demographic groups most similar to German Russians are Immigrants from Australia (12.2%, a difference of 0.23%), Immigrants from South Eastern Asia (12.2%, a difference of 0.24%), Laotian (12.3%, a difference of 0.27%), Mongolian (12.2%, a difference of 0.34%), and Nonimmigrants (12.2%, a difference of 0.45%).
| Demographics | Rating | Rank | Seniors Poverty Over the Age of 75 |
| Immigrants | Saudi Arabia | 49.5 /100 | #175 | Average 12.2% |
| Immigrants | Iran | 48.1 /100 | #176 | Average 12.2% |
| Immigrants | Asia | 47.8 /100 | #177 | Average 12.2% |
| Immigrants | Nonimmigrants | 46.8 /100 | #178 | Average 12.2% |
| Mongolians | 45.5 /100 | #179 | Average 12.2% |
| Immigrants | South Eastern Asia | 44.3 /100 | #180 | Average 12.2% |
| Immigrants | Australia | 44.2 /100 | #181 | Average 12.2% |
| German Russians | 41.4 /100 | #182 | Average 12.3% |
| Laotians | 38.2 /100 | #183 | Fair 12.3% |
| Kiowa | 36.0 /100 | #184 | Fair 12.3% |
| Immigrants | Malaysia | 35.8 /100 | #185 | Fair 12.3% |
| Sri Lankans | 32.3 /100 | #186 | Fair 12.4% |
| Yaqui | 25.9 /100 | #187 | Fair 12.5% |
| Immigrants | Northern Africa | 25.2 /100 | #188 | Fair 12.5% |
| Immigrants | Indonesia | 24.4 /100 | #189 | Fair 12.5% |