Immigrants from Cambodia vs Choctaw Poverty
COMPARE
Immigrants from Cambodia
Choctaw
Poverty
Poverty Comparison
Immigrants from Cambodia
Choctaw
13.4%
POVERTY
3.0/ 100
METRIC RATING
219th/ 347
METRIC RANK
15.6%
POVERTY
0.0/ 100
METRIC RATING
308th/ 347
METRIC RANK
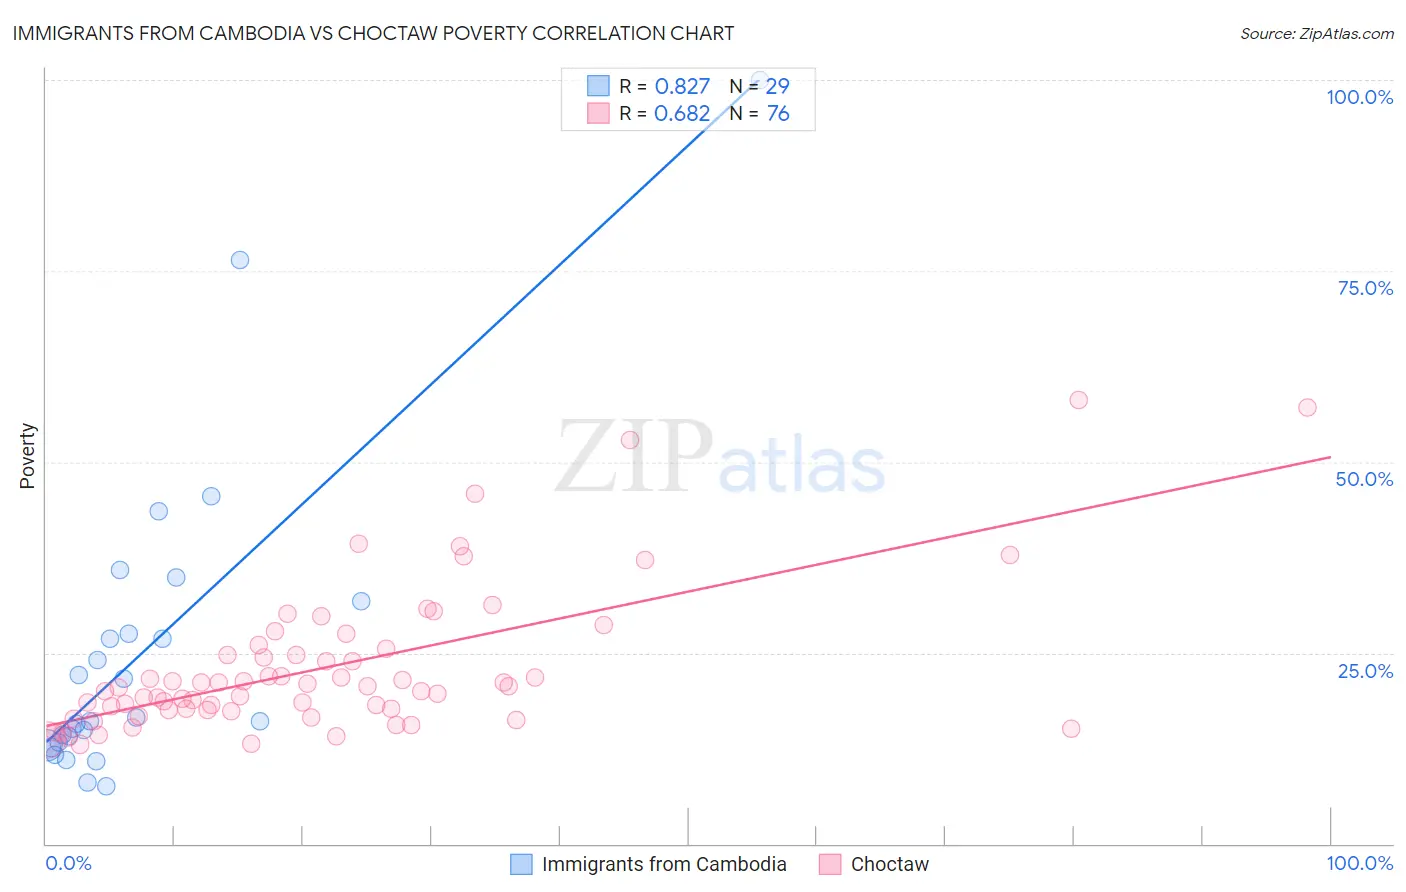
Immigrants from Cambodia vs Choctaw Poverty Correlation Chart
The statistical analysis conducted on geographies consisting of 205,130,187 people shows a very strong positive correlation between the proportion of Immigrants from Cambodia and poverty level in the United States with a correlation coefficient (R) of 0.827 and weighted average of 13.4%. Similarly, the statistical analysis conducted on geographies consisting of 269,626,558 people shows a significant positive correlation between the proportion of Choctaw and poverty level in the United States with a correlation coefficient (R) of 0.682 and weighted average of 15.6%, a difference of 16.8%.
Poverty Correlation Summary
| Measurement | Immigrants from Cambodia | Choctaw |
| Minimum | 7.5% | 13.0% |
| Maximum | 100.0% | 58.1% |
| Range | 92.5% | 45.1% |
| Mean | 25.1% | 23.1% |
| Median | 16.0% | 20.5% |
| Interquartile 25% (IQ1) | 13.1% | 17.5% |
| Interquartile 75% (IQ3) | 29.7% | 25.1% |
| Interquartile Range (IQR) | 16.6% | 7.6% |
| Standard Deviation (Sample) | 20.4% | 9.6% |
| Standard Deviation (Population) | 20.1% | 9.6% |
Similar Demographics by Poverty
Demographics Similar to Immigrants from Cambodia by Poverty
In terms of poverty, the demographic groups most similar to Immigrants from Cambodia are American (13.4%, a difference of 0.090%), Immigrants from Thailand (13.3%, a difference of 0.12%), Immigrants from Uzbekistan (13.3%, a difference of 0.19%), Japanese (13.3%, a difference of 0.23%), and Nonimmigrants (13.3%, a difference of 0.23%).
| Demographics | Rating | Rank | Poverty |
| Immigrants | Immigrants | 4.3 /100 | #212 | Tragic 13.2% |
| Immigrants | Panama | 4.1 /100 | #213 | Tragic 13.3% |
| Bermudans | 3.7 /100 | #214 | Tragic 13.3% |
| Japanese | 3.3 /100 | #215 | Tragic 13.3% |
| Immigrants | Nonimmigrants | 3.3 /100 | #216 | Tragic 13.3% |
| Immigrants | Uzbekistan | 3.2 /100 | #217 | Tragic 13.3% |
| Immigrants | Thailand | 3.1 /100 | #218 | Tragic 13.3% |
| Immigrants | Cambodia | 3.0 /100 | #219 | Tragic 13.4% |
| Americans | 2.9 /100 | #220 | Tragic 13.4% |
| Alsatians | 2.6 /100 | #221 | Tragic 13.4% |
| Immigrants | Micronesia | 2.6 /100 | #222 | Tragic 13.4% |
| Immigrants | Africa | 2.5 /100 | #223 | Tragic 13.4% |
| Immigrants | Eritrea | 2.4 /100 | #224 | Tragic 13.4% |
| German Russians | 2.2 /100 | #225 | Tragic 13.4% |
| Marshallese | 2.2 /100 | #226 | Tragic 13.4% |
Demographics Similar to Choctaw by Poverty
In terms of poverty, the demographic groups most similar to Choctaw are Seminole (15.6%, a difference of 0.040%), African (15.6%, a difference of 0.11%), Dutch West Indian (15.6%, a difference of 0.13%), Creek (15.6%, a difference of 0.18%), and Chippewa (15.7%, a difference of 0.52%).
| Demographics | Rating | Rank | Poverty |
| Bahamians | 0.0 /100 | #301 | Tragic 15.4% |
| Somalis | 0.0 /100 | #302 | Tragic 15.4% |
| Immigrants | Caribbean | 0.0 /100 | #303 | Tragic 15.5% |
| Immigrants | Mexico | 0.0 /100 | #304 | Tragic 15.5% |
| Immigrants | Guatemala | 0.0 /100 | #305 | Tragic 15.5% |
| Creek | 0.0 /100 | #306 | Tragic 15.6% |
| Africans | 0.0 /100 | #307 | Tragic 15.6% |
| Choctaw | 0.0 /100 | #308 | Tragic 15.6% |
| Seminole | 0.0 /100 | #309 | Tragic 15.6% |
| Dutch West Indians | 0.0 /100 | #310 | Tragic 15.6% |
| Chippewa | 0.0 /100 | #311 | Tragic 15.7% |
| Cajuns | 0.0 /100 | #312 | Tragic 15.7% |
| Immigrants | Grenada | 0.0 /100 | #313 | Tragic 15.8% |
| Immigrants | Somalia | 0.0 /100 | #314 | Tragic 15.8% |
| British West Indians | 0.0 /100 | #315 | Tragic 15.9% |