Immigrants from Armenia vs Korean Child Poverty Among Girls Under 16

COMPARE

Immigrants from Armenia
Race
Ancestry
AfghanAfricanAlaska NativeAlaskan AthabascanAlbanianAleutAlsatianAmericanApacheArabArapahoArgentineanArmenianAssyrian/Chaldean/SyriacAustralianAustrianBahamianBangladeshiBarbadianBasqueBelgianBelizeanBermudanBhutaneseBlackfeetBolivianBrazilianBritishBritish West IndianBulgarianBurmeseCajunCambodianCanadianCape VerdeanCarpatho RusynCelticCentral AmericanCentral American IndianCherokeeCheyenneChickasawChileanChineseChippewaChoctawColombianColvilleComancheCosta RicanCreeCreekCroatianCrowCubanCypriotCzechCzechoslovakianDanishDelawareDominicanDutchDutch West IndianEastern EuropeanEcuadorianEgyptianEnglishEstonianEthiopianEuropeanFijianFilipinoFinnishFrenchFrench American IndianFrench CanadianGermanGerman RussianGhanaianGreekGuamanian/ChamorroGuatemalanGuyaneseHaitianHmongHonduranHopiHoumaHungarianIcelanderIndian (Asian)IndonesianInupiatIranianIraqiIrishIroquoisIsraeliItalianJamaicanJapaneseJordanianKenyanKiowaLaotianLatvianLebaneseLiberianLithuanianLumbeeLuxembourgerMacedonianMalaysianMalteseMarshalleseMenomineeMexicanMexican American IndianMongolianMoroccanNative HawaiianNavajoNepaleseNew ZealanderNicaraguanNigerianNorthern EuropeanNorwegianOkinawanOsageOttawaPaiutePakistaniPalestinianPanamanianParaguayanPennsylvania GermanPeruvianPimaPolishPortuguesePotawatomiPuebloPuerto RicanPuget Sound SalishRomanianRussianSalvadoranSamoanScandinavianScotch-IrishScottishSeminoleSenegaleseSerbianShoshoneSierra LeoneanSiouxSlavicSlovakSloveneSomaliSouth AfricanSouth AmericanSouth American IndianSoviet UnionSpaniardSpanishSpanish AmericanSpanish American IndianSri LankanSubsaharan AfricanSudaneseSwedishSwissSyrianTaiwaneseThaiTlingit-HaidaTohono O'OdhamTonganTrinidadian and TobagonianTsimshianTurkishU.S. Virgin IslanderUgandanUkrainianUruguayanUteVenezuelanVietnameseWelshWest IndianYakamaYaquiYugoslavianYumanYup'ikZimbabwean
Immigration
NonimmigrantsImmigrantsAfghanistanAfricaAlbaniaArgentinaArmeniaAsiaAustraliaAustriaBahamasBangladeshBarbadosBelarusBelgiumBelizeBoliviaBosnia and HerzegovinaBrazilBulgariaBurma/MyanmarCabo VerdeCambodiaCameroonCanadaCaribbeanCentral AmericaChileChinaColombiaCongoCosta RicaCroatiaCubaCzechoslovakiaDenmarkDominicaDominican RepublicEastern AfricaEastern AsiaEastern EuropeEcuadorEgyptEl SalvadorEnglandEritreaEthiopiaEuropeFijiFranceGermanyGhanaGreeceGrenadaGuatemalaGuyanaHaitiHondurasHong KongHungaryIndiaIndonesiaIranIraqIrelandIsraelItalyJamaicaJapanJordanKazakhstanKenyaKoreaKuwaitLaosLatin AmericaLatviaLebanonLiberiaLithuaniaMalaysiaMexicoMicronesiaMiddle AfricaMoldovaMoroccoNepalNetherlandsNicaraguaNigeriaNorth AmericaNorth MacedoniaNorthern AfricaNorthern EuropeNorwayOceaniaPakistanPanamaPeruPhilippinesPolandPortugalRomaniaRussiaSaudi ArabiaScotlandSenegalSerbiaSierra LeoneSingaporeSomaliaSouth AfricaSouth AmericaSouth Central AsiaSouth Eastern AsiaSouthern EuropeSpainSri LankaSt. Vincent and the GrenadinesSudanSwedenSwitzerlandSyriaTaiwanThailandTrinidad and TobagoTurkeyUgandaUkraineUruguayUzbekistanVenezuelaVietnamWest IndiesWestern AfricaWestern AsiaWestern EuropeYemenZaireZimbabweAzores
Korean
Race
Ancestry
AfghanAfricanAlaska NativeAlaskan AthabascanAlbanianAleutAlsatianAmericanApacheArabArapahoArgentineanArmenianAssyrian/Chaldean/SyriacAustralianAustrianBahamianBangladeshiBarbadianBasqueBelgianBelizeanBermudanBhutaneseBlackfeetBolivianBrazilianBritishBritish West IndianBulgarianBurmeseCajunCambodianCanadianCape VerdeanCarpatho RusynCelticCentral AmericanCentral American IndianCherokeeCheyenneChickasawChileanChineseChippewaChoctawColombianColvilleComancheCosta RicanCreeCreekCroatianCrowCubanCypriotCzechCzechoslovakianDanishDelawareDominicanDutchDutch West IndianEastern EuropeanEcuadorianEgyptianEnglishEstonianEthiopianEuropeanFijianFilipinoFinnishFrenchFrench American IndianFrench CanadianGermanGerman RussianGhanaianGreekGuamanian/ChamorroGuatemalanGuyaneseHaitianHmongHonduranHopiHoumaHungarianIcelanderIndian (Asian)IndonesianInupiatIranianIraqiIrishIroquoisIsraeliItalianJamaicanJapaneseJordanianKenyanKiowaKoreanLaotianLatvianLebaneseLiberianLithuanianLumbeeLuxembourgerMacedonianMalaysianMalteseMarshalleseMenomineeMexicanMexican American IndianMongolianMoroccanNative HawaiianNavajoNepaleseNew ZealanderNicaraguanNigerianNorthern EuropeanNorwegianOkinawanOsageOttawaPaiutePakistaniPalestinianPanamanianParaguayanPennsylvania GermanPeruvianPimaPolishPortuguesePotawatomiPuebloPuerto RicanPuget Sound SalishRomanianRussianSalvadoranSamoanScandinavianScotch-IrishScottishSeminoleSenegaleseSerbianShoshoneSierra LeoneanSiouxSlavicSlovakSloveneSomaliSouth AfricanSouth AmericanSouth American IndianSoviet UnionSpaniardSpanishSpanish AmericanSpanish American IndianSri LankanSubsaharan AfricanSudaneseSwedishSwissSyrianTaiwaneseThaiTlingit-HaidaTohono O'OdhamTonganTrinidadian and TobagonianTsimshianTurkishU.S. Virgin IslanderUgandanUkrainianUruguayanUteVenezuelanVietnameseWelshWest IndianYakamaYaquiYugoslavianYumanYup'ikZimbabwean
Immigration
NonimmigrantsImmigrantsAfghanistanAfricaAlbaniaArgentinaAsiaAustraliaAustriaBahamasBangladeshBarbadosBelarusBelgiumBelizeBoliviaBosnia and HerzegovinaBrazilBulgariaBurma/MyanmarCabo VerdeCambodiaCameroonCanadaCaribbeanCentral AmericaChileChinaColombiaCongoCosta RicaCroatiaCubaCzechoslovakiaDenmarkDominicaDominican RepublicEastern AfricaEastern AsiaEastern EuropeEcuadorEgyptEl SalvadorEnglandEritreaEthiopiaEuropeFijiFranceGermanyGhanaGreeceGrenadaGuatemalaGuyanaHaitiHondurasHong KongHungaryIndiaIndonesiaIranIraqIrelandIsraelItalyJamaicaJapanJordanKazakhstanKenyaKoreaKuwaitLaosLatin AmericaLatviaLebanonLiberiaLithuaniaMalaysiaMexicoMicronesiaMiddle AfricaMoldovaMoroccoNepalNetherlandsNicaraguaNigeriaNorth AmericaNorth MacedoniaNorthern AfricaNorthern EuropeNorwayOceaniaPakistanPanamaPeruPhilippinesPolandPortugalRomaniaRussiaSaudi ArabiaScotlandSenegalSerbiaSierra LeoneSingaporeSomaliaSouth AfricaSouth AmericaSouth Central AsiaSouth Eastern AsiaSouthern EuropeSpainSri LankaSt. Vincent and the GrenadinesSudanSwedenSwitzerlandSyriaTaiwanThailandTrinidad and TobagoTurkeyUgandaUkraineUruguayUzbekistanVenezuelaVietnamWest IndiesWestern AfricaWestern AsiaWestern EuropeYemenZaireZimbabweAzores
Child Poverty Among Girls Under 16
Income
Poverty
Unemployment
Labor Participation
Family Structure
Vehicle Availability
Education Level
Disability

Child Poverty Among Girls Under 16 Comparison

Immigrants from Armenia

Koreans

Tragic
Exceptional
18.1%
CHILD POVERTY AMONG GIRLS UNDER 16
2.9/ 100
METRIC RATING
223rd/ 347
METRIC RANK
14.1%
CHILD POVERTY AMONG GIRLS UNDER 16
99.4/ 100
METRIC RATING
43rd/ 347
METRIC RANK

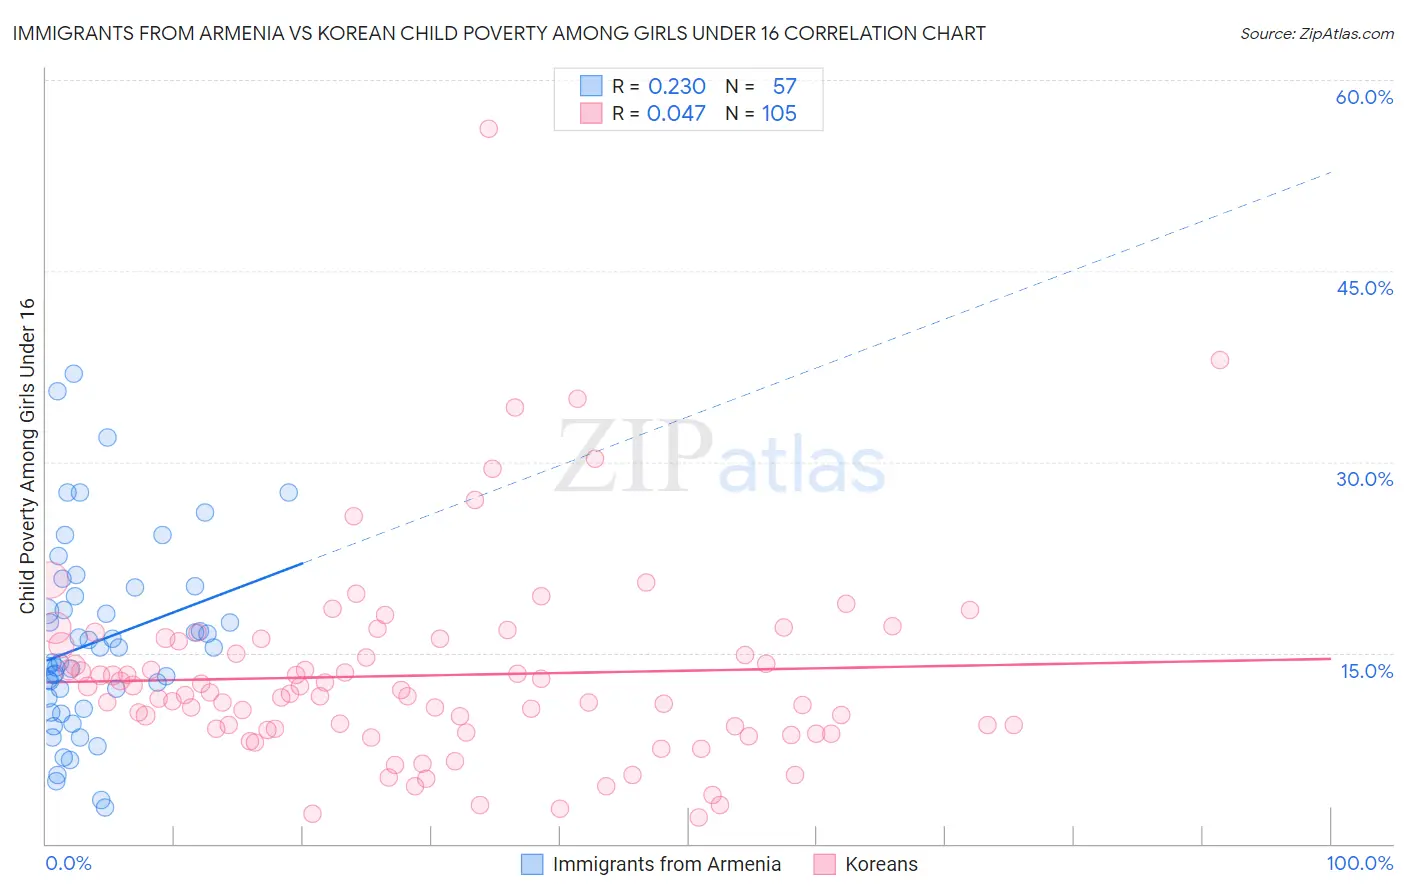
Immigrants from Armenia vs Korean Child Poverty Among Girls Under 16 Correlation Chart

The statistical analysis conducted on geographies consisting of 96,961,267 people shows a weak positive correlation between the proportion of Immigrants from Armenia and poverty level among girls under the age of 16 in the United States with a correlation coefficient (R) of 0.230 and weighted average of 18.1%. Similarly, the statistical analysis conducted on geographies consisting of 497,455,609 people shows no correlation between the proportion of Koreans and poverty level among girls under the age of 16 in the United States with a correlation coefficient (R) of 0.047 and weighted average of 14.1%, a difference of 29.0%.
Immigrants from Armenia vs Korean Child Poverty Among Girls Under 16

Child Poverty Among Girls Under 16 Correlation Summary

MeasurementImmigrants from ArmeniaKorean
Minimum2.9%2.1%
Maximum36.9%56.1%
Range34.0%54.0%
Mean15.9%13.2%
Median15.4%11.8%
Interquartile 25% (IQ1)11.0%9.0%
Interquartile 75% (IQ3)19.8%16.0%
Interquartile Range (IQR)8.8%7.0%
Standard Deviation (Sample)7.4%7.8%
Standard Deviation (Population)7.4%7.8%

Similar Demographics by Child Poverty Among Girls Under 16

Demographics Similar to Immigrants from Armenia by Child Poverty Among Girls Under 16

In terms of child poverty among girls under 16, the demographic groups most similar to Immigrants from Armenia are Immigrants from Cambodia (18.1%, a difference of 0.0%), Bermudan (18.1%, a difference of 0.070%), Immigrants from Africa (18.2%, a difference of 0.17%), Nicaraguan (18.2%, a difference of 0.50%), and Immigrants from Micronesia (18.0%, a difference of 0.52%).
DemographicsRating | RankChild Poverty Among Girls Under 16
Moroccans
5.5
/100
|
#216
Tragic
17.8%
Japanese
5.3
/100
|
#217
Tragic
17.8%
Alaska Natives
5.2
/100
|
#218
Tragic
17.8%
Immigrants | Panama
4.7
/100
|
#219
Tragic
17.9%
Cubans
4.1
/100
|
#220
Tragic
18.0%
Immigrants | Micronesia
3.5
/100
|
#221
Tragic
18.0%
Immigrants | Cambodia
2.9
/100
|
#222
Tragic
18.1%
Immigrants | Armenia
2.9
/100
|
#223
Tragic
18.1%
Bermudans
2.8
/100
|
#224
Tragic
18.1%
Immigrants | Africa
2.7
/100
|
#225
Tragic
18.2%
Nicaraguans
2.4
/100
|
#226
Tragic
18.2%
Immigrants | Nonimmigrants
2.0
/100
|
#227
Tragic
18.3%
Alaskan Athabascans
2.0
/100
|
#228
Tragic
18.3%
Ghanaians
1.4
/100
|
#229
Tragic
18.5%
Osage
1.3
/100
|
#230
Tragic
18.5%

Demographics Similar to Koreans by Child Poverty Among Girls Under 16

In terms of child poverty among girls under 16, the demographic groups most similar to Koreans are Immigrants from Scotland (14.0%, a difference of 0.14%), Immigrants from Asia (14.1%, a difference of 0.14%), Immigrants from Sri Lanka (14.0%, a difference of 0.31%), Immigrants from Bolivia (14.0%, a difference of 0.31%), and Immigrants from Australia (14.0%, a difference of 0.40%).
DemographicsRating | RankChild Poverty Among Girls Under 16
Russians
99.6
/100
|
#36
Exceptional
13.9%
Lithuanians
99.6
/100
|
#37
Exceptional
13.9%
Immigrants | Moldova
99.6
/100
|
#38
Exceptional
13.9%
Immigrants | Australia
99.5
/100
|
#39
Exceptional
14.0%
Immigrants | Sri Lanka
99.5
/100
|
#40
Exceptional
14.0%
Immigrants | Bolivia
99.5
/100
|
#41
Exceptional
14.0%
Immigrants | Scotland
99.4
/100
|
#42
Exceptional
14.0%
Koreans
99.4
/100
|
#43
Exceptional
14.1%
Immigrants | Asia
99.4
/100
|
#44
Exceptional
14.1%
Immigrants | Greece
99.3
/100
|
#45
Exceptional
14.1%
Croatians
99.3
/100
|
#46
Exceptional
14.1%
Immigrants | Czechoslovakia
99.3
/100
|
#47
Exceptional
14.2%
Czechs
99.3
/100
|
#48
Exceptional
14.2%
Greeks
99.2
/100
|
#49
Exceptional
14.2%
Immigrants | Israel
99.2
/100
|
#50
Exceptional
14.2%