Immigrants from Africa vs Nepalese Single Mother Poverty
COMPARE
Immigrants from Africa
Nepalese
Single Mother Poverty
Single Mother Poverty Comparison
Immigrants from Africa
Nepalese
29.4%
SINGLE MOTHER POVERTY
31.6/ 100
METRIC RATING
189th/ 347
METRIC RANK
29.3%
SINGLE MOTHER POVERTY
38.3/ 100
METRIC RATING
183rd/ 347
METRIC RANK
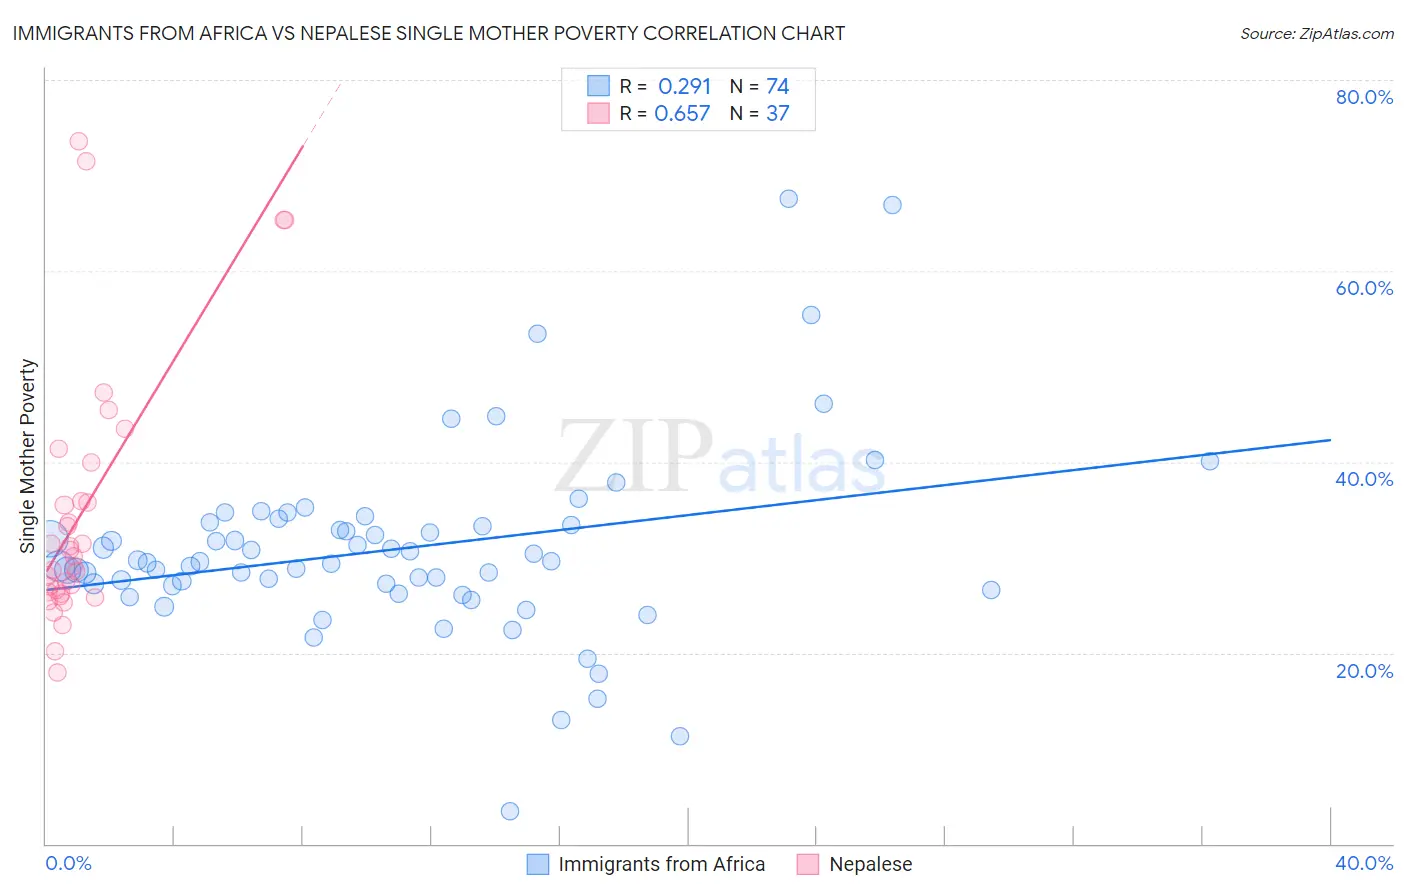
Immigrants from Africa vs Nepalese Single Mother Poverty Correlation Chart
The statistical analysis conducted on geographies consisting of 456,007,162 people shows a weak positive correlation between the proportion of Immigrants from Africa and poverty level among single mothers in the United States with a correlation coefficient (R) of 0.291 and weighted average of 29.4%. Similarly, the statistical analysis conducted on geographies consisting of 24,439,991 people shows a significant positive correlation between the proportion of Nepalese and poverty level among single mothers in the United States with a correlation coefficient (R) of 0.657 and weighted average of 29.3%, a difference of 0.35%.
Single Mother Poverty Correlation Summary
| Measurement | Immigrants from Africa | Nepalese |
| Minimum | 3.4% | 17.9% |
| Maximum | 67.6% | 73.6% |
| Range | 64.1% | 55.7% |
| Mean | 30.9% | 34.7% |
| Median | 29.5% | 30.1% |
| Interquartile 25% (IQ1) | 27.1% | 26.3% |
| Interquartile 75% (IQ3) | 33.3% | 37.9% |
| Interquartile Range (IQR) | 6.3% | 11.7% |
| Standard Deviation (Sample) | 10.1% | 13.8% |
| Standard Deviation (Population) | 10.0% | 13.6% |
Demographics Similar to Immigrants from Africa and Nepalese by Single Mother Poverty
In terms of single mother poverty, the demographic groups most similar to Immigrants from Africa are Guamanian/Chamorro (29.4%, a difference of 0.010%), Lebanese (29.4%, a difference of 0.050%), Immigrants from Germany (29.5%, a difference of 0.070%), Immigrants from Trinidad and Tobago (29.5%, a difference of 0.13%), and Moroccan (29.5%, a difference of 0.17%). Similarly, the demographic groups most similar to Nepalese are Immigrants from Eastern Africa (29.3%, a difference of 0.010%), Nigerian (29.3%, a difference of 0.010%), Ghanaian (29.4%, a difference of 0.070%), Canadian (29.3%, a difference of 0.11%), and Yugoslavian (29.4%, a difference of 0.11%).
| Demographics | Rating | Rank | Single Mother Poverty |
| Hawaiians | 47.8 /100 | #176 | Average 29.2% |
| Immigrants | Bosnia and Herzegovina | 45.1 /100 | #177 | Average 29.2% |
| South American Indians | 43.2 /100 | #178 | Average 29.3% |
| Immigrants | Uzbekistan | 42.6 /100 | #179 | Average 29.3% |
| Immigrants | Norway | 41.5 /100 | #180 | Average 29.3% |
| Canadians | 40.4 /100 | #181 | Average 29.3% |
| Immigrants | Eastern Africa | 38.5 /100 | #182 | Fair 29.3% |
| Nepalese | 38.3 /100 | #183 | Fair 29.3% |
| Nigerians | 38.0 /100 | #184 | Fair 29.3% |
| Ghanaians | 36.8 /100 | #185 | Fair 29.4% |
| Yugoslavians | 36.0 /100 | #186 | Fair 29.4% |
| Lebanese | 32.5 /100 | #187 | Fair 29.4% |
| Guamanians/Chamorros | 31.8 /100 | #188 | Fair 29.4% |
| Immigrants | Africa | 31.6 /100 | #189 | Fair 29.4% |
| Immigrants | Germany | 30.4 /100 | #190 | Fair 29.5% |
| Immigrants | Trinidad and Tobago | 29.2 /100 | #191 | Fair 29.5% |
| Moroccans | 28.6 /100 | #192 | Fair 29.5% |
| Basques | 28.3 /100 | #193 | Fair 29.5% |
| Icelanders | 26.1 /100 | #194 | Fair 29.5% |
| Slavs | 24.5 /100 | #195 | Fair 29.6% |
| Spanish American Indians | 23.4 /100 | #196 | Fair 29.6% |