Icelander vs Immigrants from Middle Africa Receiving Food Stamps
COMPARE
Icelander
Immigrants from Middle Africa
Receiving Food Stamps
Receiving Food Stamps Comparison
Icelanders
Immigrants from Middle Africa
10.5%
RECEIVING FOOD STAMPS
95.4/ 100
METRIC RATING
113th/ 347
METRIC RANK
12.9%
RECEIVING FOOD STAMPS
5.4/ 100
METRIC RATING
219th/ 347
METRIC RANK
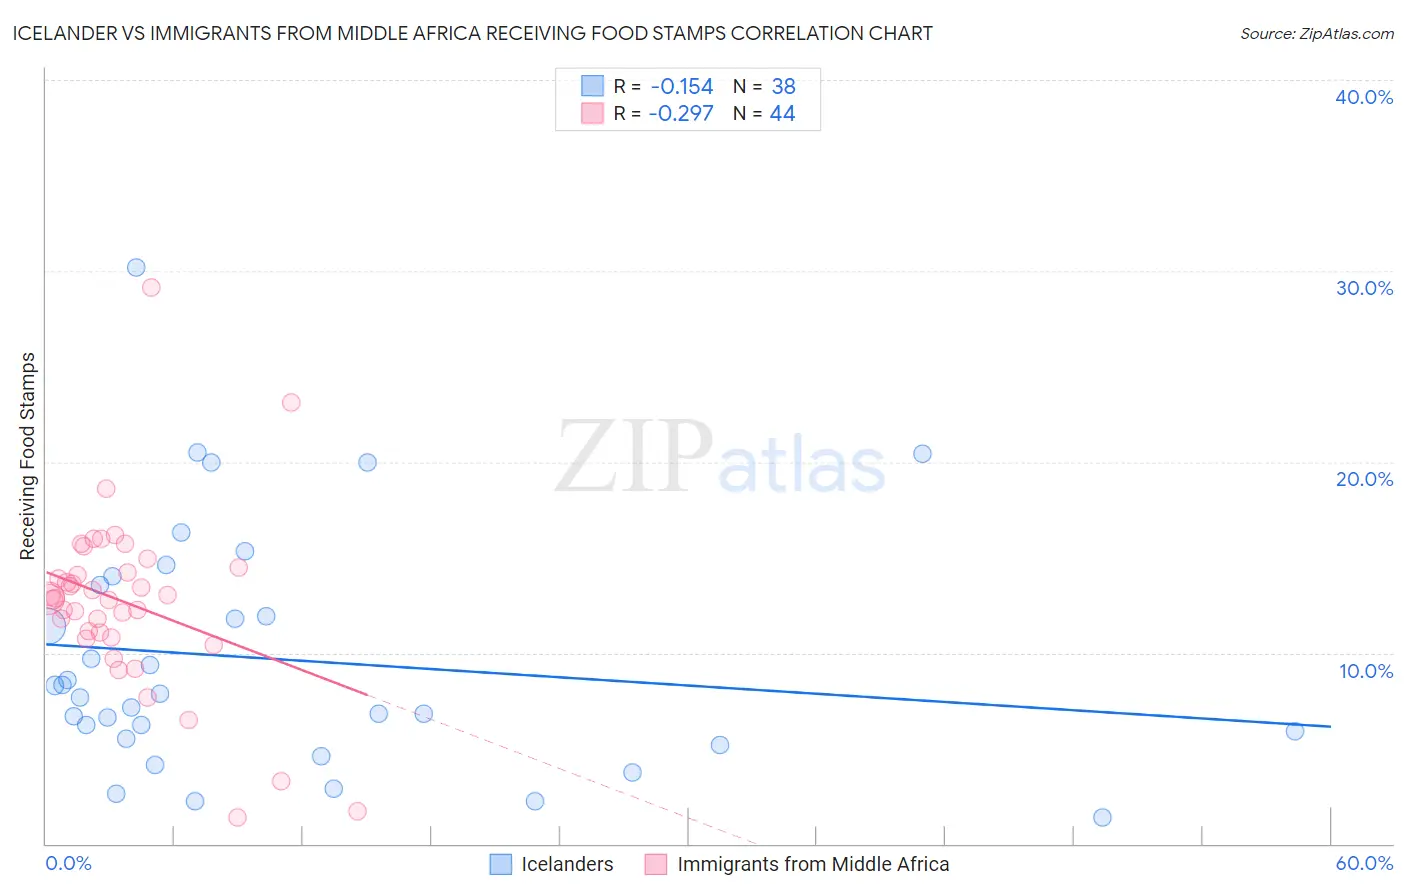
Icelander vs Immigrants from Middle Africa Receiving Food Stamps Correlation Chart
The statistical analysis conducted on geographies consisting of 159,460,125 people shows a poor negative correlation between the proportion of Icelanders and percentage of population receiving government assistance and/or food stamps in the United States with a correlation coefficient (R) of -0.154 and weighted average of 10.5%. Similarly, the statistical analysis conducted on geographies consisting of 202,565,128 people shows a weak negative correlation between the proportion of Immigrants from Middle Africa and percentage of population receiving government assistance and/or food stamps in the United States with a correlation coefficient (R) of -0.297 and weighted average of 12.9%, a difference of 23.1%.
Receiving Food Stamps Correlation Summary
| Measurement | Icelander | Immigrants from Middle Africa |
| Minimum | 1.4% | 1.4% |
| Maximum | 30.2% | 29.1% |
| Range | 28.8% | 27.7% |
| Mean | 9.6% | 12.7% |
| Median | 7.8% | 12.9% |
| Interquartile 25% (IQ1) | 5.5% | 10.9% |
| Interquartile 75% (IQ3) | 13.6% | 14.3% |
| Interquartile Range (IQR) | 8.1% | 3.4% |
| Standard Deviation (Sample) | 6.4% | 4.7% |
| Standard Deviation (Population) | 6.3% | 4.6% |
Similar Demographics by Receiving Food Stamps
Demographics Similar to Icelanders by Receiving Food Stamps
In terms of receiving food stamps, the demographic groups most similar to Icelanders are Scotch-Irish (10.5%, a difference of 0.30%), Mongolian (10.5%, a difference of 0.38%), Romanian (10.4%, a difference of 0.39%), Immigrants from Saudi Arabia (10.5%, a difference of 0.48%), and Pakistani (10.4%, a difference of 0.49%).
| Demographics | Rating | Rank | Receiving Food Stamps |
| Immigrants | Italy | 96.4 /100 | #106 | Exceptional 10.4% |
| Koreans | 96.3 /100 | #107 | Exceptional 10.4% |
| Carpatho Rusyns | 96.2 /100 | #108 | Exceptional 10.4% |
| Immigrants | Pakistan | 96.2 /100 | #109 | Exceptional 10.4% |
| Pakistanis | 95.9 /100 | #110 | Exceptional 10.4% |
| Romanians | 95.8 /100 | #111 | Exceptional 10.4% |
| Mongolians | 95.8 /100 | #112 | Exceptional 10.5% |
| Icelanders | 95.4 /100 | #113 | Exceptional 10.5% |
| Scotch-Irish | 95.1 /100 | #114 | Exceptional 10.5% |
| Immigrants | Saudi Arabia | 94.9 /100 | #115 | Exceptional 10.5% |
| Canadians | 94.8 /100 | #116 | Exceptional 10.5% |
| Immigrants | Nepal | 94.6 /100 | #117 | Exceptional 10.6% |
| Assyrians/Chaldeans/Syriacs | 94.1 /100 | #118 | Exceptional 10.6% |
| Immigrants | Poland | 93.9 /100 | #119 | Exceptional 10.6% |
| Ethiopians | 93.9 /100 | #120 | Exceptional 10.6% |
Demographics Similar to Immigrants from Middle Africa by Receiving Food Stamps
In terms of receiving food stamps, the demographic groups most similar to Immigrants from Middle Africa are Hawaiian (12.9%, a difference of 0.010%), Immigrants from Colombia (12.9%, a difference of 0.040%), Bermudan (13.0%, a difference of 0.36%), Immigrants from Burma/Myanmar (12.9%, a difference of 0.38%), and Immigrants (13.0%, a difference of 0.62%).
| Demographics | Rating | Rank | Receiving Food Stamps |
| Malaysians | 8.5 /100 | #212 | Tragic 12.7% |
| Moroccans | 7.6 /100 | #213 | Tragic 12.8% |
| Immigrants | Africa | 7.6 /100 | #214 | Tragic 12.8% |
| Native Hawaiians | 6.7 /100 | #215 | Tragic 12.8% |
| Immigrants | South America | 6.5 /100 | #216 | Tragic 12.8% |
| Immigrants | Burma/Myanmar | 6.0 /100 | #217 | Tragic 12.9% |
| Hawaiians | 5.4 /100 | #218 | Tragic 12.9% |
| Immigrants | Middle Africa | 5.4 /100 | #219 | Tragic 12.9% |
| Immigrants | Colombia | 5.3 /100 | #220 | Tragic 12.9% |
| Bermudans | 4.8 /100 | #221 | Tragic 13.0% |
| Immigrants | Immigrants | 4.4 /100 | #222 | Tragic 13.0% |
| Immigrants | Albania | 4.4 /100 | #223 | Tragic 13.0% |
| Immigrants | Armenia | 4.3 /100 | #224 | Tragic 13.0% |
| Fijians | 4.3 /100 | #225 | Tragic 13.0% |
| Chickasaw | 3.6 /100 | #226 | Tragic 13.1% |