Hmong vs Haitian Single Mother Poverty
COMPARE
Hmong
Haitian
Single Mother Poverty
Single Mother Poverty Comparison
Hmong
Haitians
31.2%
SINGLE MOTHER POVERTY
0.3/ 100
METRIC RATING
262nd/ 347
METRIC RANK
29.8%
SINGLE MOTHER POVERTY
13.3/ 100
METRIC RATING
210th/ 347
METRIC RANK
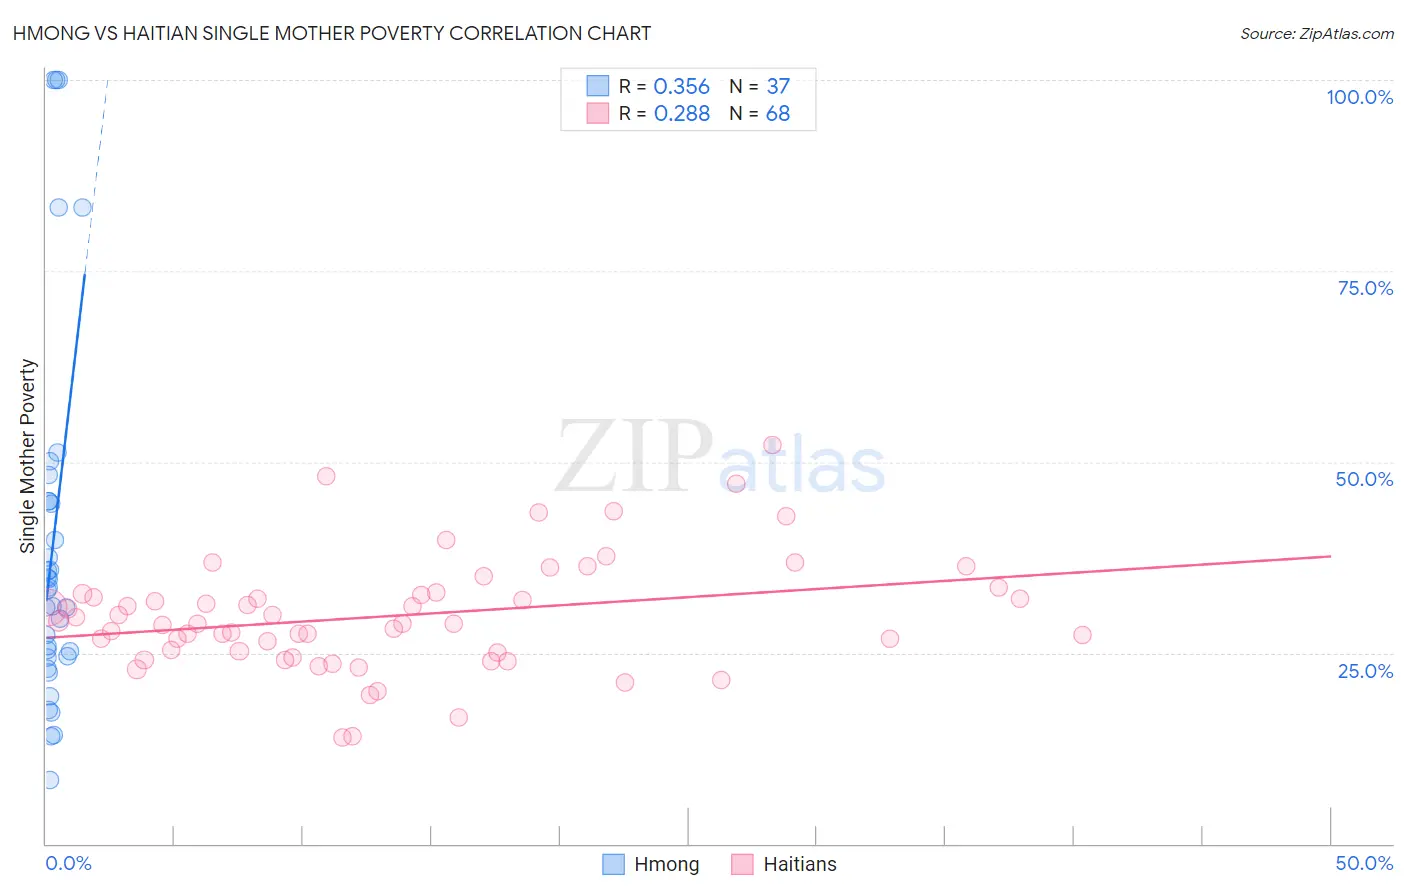
Hmong vs Haitian Single Mother Poverty Correlation Chart
The statistical analysis conducted on geographies consisting of 24,640,250 people shows a mild positive correlation between the proportion of Hmong and poverty level among single mothers in the United States with a correlation coefficient (R) of 0.356 and weighted average of 31.2%. Similarly, the statistical analysis conducted on geographies consisting of 283,035,153 people shows a weak positive correlation between the proportion of Haitians and poverty level among single mothers in the United States with a correlation coefficient (R) of 0.288 and weighted average of 29.8%, a difference of 4.8%.
Single Mother Poverty Correlation Summary
| Measurement | Hmong | Haitian |
| Minimum | 8.4% | 13.8% |
| Maximum | 100.0% | 52.2% |
| Range | 91.6% | 38.4% |
| Mean | 39.1% | 29.8% |
| Median | 33.2% | 28.8% |
| Interquartile 25% (IQ1) | 24.5% | 25.1% |
| Interquartile 75% (IQ3) | 44.8% | 32.7% |
| Interquartile Range (IQR) | 20.3% | 7.6% |
| Standard Deviation (Sample) | 24.2% | 7.4% |
| Standard Deviation (Population) | 23.9% | 7.4% |
Similar Demographics by Single Mother Poverty
Demographics Similar to Hmong by Single Mother Poverty
In terms of single mother poverty, the demographic groups most similar to Hmong are Immigrants from El Salvador (31.2%, a difference of 0.14%), White/Caucasian (31.2%, a difference of 0.21%), Bahamian (31.3%, a difference of 0.27%), Immigrants from Ecuador (31.3%, a difference of 0.28%), and German Russian (31.3%, a difference of 0.31%).
| Demographics | Rating | Rank | Single Mother Poverty |
| Belizeans | 0.5 /100 | #255 | Tragic 31.0% |
| Immigrants | West Indies | 0.4 /100 | #256 | Tragic 31.1% |
| Immigrants | Bahamas | 0.4 /100 | #257 | Tragic 31.1% |
| Immigrants | Caribbean | 0.4 /100 | #258 | Tragic 31.1% |
| Immigrants | Bangladesh | 0.4 /100 | #259 | Tragic 31.1% |
| Whites/Caucasians | 0.3 /100 | #260 | Tragic 31.2% |
| Immigrants | El Salvador | 0.3 /100 | #261 | Tragic 31.2% |
| Hmong | 0.3 /100 | #262 | Tragic 31.2% |
| Bahamians | 0.2 /100 | #263 | Tragic 31.3% |
| Immigrants | Ecuador | 0.2 /100 | #264 | Tragic 31.3% |
| German Russians | 0.2 /100 | #265 | Tragic 31.3% |
| Sub-Saharan Africans | 0.2 /100 | #266 | Tragic 31.4% |
| Immigrants | Belize | 0.2 /100 | #267 | Tragic 31.4% |
| Immigrants | Senegal | 0.1 /100 | #268 | Tragic 31.5% |
| Scotch-Irish | 0.1 /100 | #269 | Tragic 31.5% |
Demographics Similar to Haitians by Single Mother Poverty
In terms of single mother poverty, the demographic groups most similar to Haitians are Guyanese (29.8%, a difference of 0.050%), Irish (29.8%, a difference of 0.060%), Nicaraguan (29.8%, a difference of 0.090%), Immigrants from Guyana (29.8%, a difference of 0.14%), and Immigrants from Thailand (29.9%, a difference of 0.14%).
| Demographics | Rating | Rank | Single Mother Poverty |
| Swiss | 17.2 /100 | #203 | Poor 29.7% |
| Immigrants | Immigrants | 16.6 /100 | #204 | Poor 29.7% |
| Czechoslovakians | 16.1 /100 | #205 | Poor 29.7% |
| Immigrants | Haiti | 15.8 /100 | #206 | Poor 29.7% |
| Immigrants | Panama | 15.5 /100 | #207 | Poor 29.8% |
| Immigrants | Guyana | 14.7 /100 | #208 | Poor 29.8% |
| Irish | 13.9 /100 | #209 | Poor 29.8% |
| Haitians | 13.3 /100 | #210 | Poor 29.8% |
| Guyanese | 12.8 /100 | #211 | Poor 29.8% |
| Nicaraguans | 12.4 /100 | #212 | Poor 29.8% |
| Immigrants | Thailand | 12.0 /100 | #213 | Poor 29.9% |
| Liberians | 11.7 /100 | #214 | Poor 29.9% |
| Jamaicans | 11.7 /100 | #215 | Poor 29.9% |
| Immigrants | Western Africa | 11.5 /100 | #216 | Poor 29.9% |
| Immigrants | Ghana | 11.3 /100 | #217 | Poor 29.9% |