Haitian vs Uruguayan Female Poverty
COMPARE
Haitian
Uruguayan
Female Poverty
Female Poverty Comparison
Haitians
Uruguayans
15.9%
FEMALE POVERTY
0.0/ 100
METRIC RATING
273rd/ 347
METRIC RANK
13.6%
FEMALE POVERTY
39.8/ 100
METRIC RATING
189th/ 347
METRIC RANK
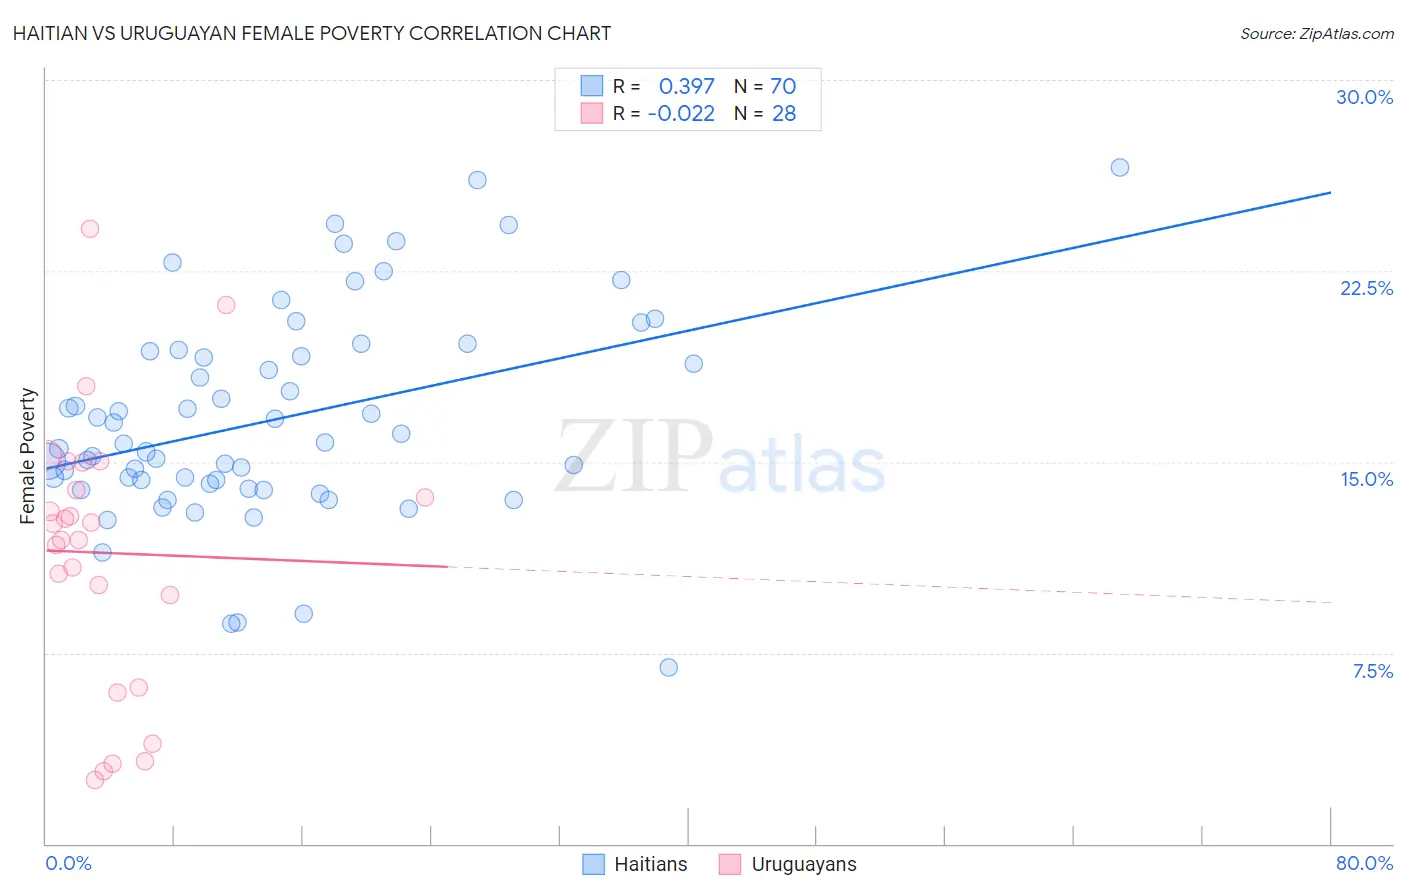
Haitian vs Uruguayan Female Poverty Correlation Chart
The statistical analysis conducted on geographies consisting of 287,638,574 people shows a mild positive correlation between the proportion of Haitians and poverty level among females in the United States with a correlation coefficient (R) of 0.397 and weighted average of 15.9%. Similarly, the statistical analysis conducted on geographies consisting of 144,759,999 people shows no correlation between the proportion of Uruguayans and poverty level among females in the United States with a correlation coefficient (R) of -0.022 and weighted average of 13.6%, a difference of 17.4%.
Female Poverty Correlation Summary
| Measurement | Haitian | Uruguayan |
| Minimum | 6.9% | 2.5% |
| Maximum | 26.6% | 24.1% |
| Range | 19.6% | 21.6% |
| Mean | 16.7% | 11.4% |
| Median | 15.8% | 12.3% |
| Interquartile 25% (IQ1) | 14.1% | 8.0% |
| Interquartile 75% (IQ3) | 19.3% | 14.4% |
| Interquartile Range (IQR) | 5.2% | 6.5% |
| Standard Deviation (Sample) | 4.1% | 5.4% |
| Standard Deviation (Population) | 4.1% | 5.3% |
Similar Demographics by Female Poverty
Demographics Similar to Haitians by Female Poverty
In terms of female poverty, the demographic groups most similar to Haitians are Belizean (15.9%, a difference of 0.0%), Barbadian (15.9%, a difference of 0.0%), Immigrants from Barbados (16.0%, a difference of 0.070%), Central American (16.0%, a difference of 0.20%), and Immigrants from St. Vincent and the Grenadines (15.9%, a difference of 0.23%).
| Demographics | Rating | Rank | Female Poverty |
| Immigrants | El Salvador | 0.1 /100 | #266 | Tragic 15.7% |
| Sub-Saharan Africans | 0.1 /100 | #267 | Tragic 15.8% |
| Immigrants | Nicaragua | 0.1 /100 | #268 | Tragic 15.8% |
| Iroquois | 0.1 /100 | #269 | Tragic 15.8% |
| Chickasaw | 0.1 /100 | #270 | Tragic 15.9% |
| Immigrants | St. Vincent and the Grenadines | 0.0 /100 | #271 | Tragic 15.9% |
| Belizeans | 0.0 /100 | #272 | Tragic 15.9% |
| Haitians | 0.0 /100 | #273 | Tragic 15.9% |
| Barbadians | 0.0 /100 | #274 | Tragic 15.9% |
| Immigrants | Barbados | 0.0 /100 | #275 | Tragic 16.0% |
| Central Americans | 0.0 /100 | #276 | Tragic 16.0% |
| Bangladeshis | 0.0 /100 | #277 | Tragic 16.0% |
| Immigrants | West Indies | 0.0 /100 | #278 | Tragic 16.1% |
| Immigrants | Bahamas | 0.0 /100 | #279 | Tragic 16.1% |
| Vietnamese | 0.0 /100 | #280 | Tragic 16.1% |
Demographics Similar to Uruguayans by Female Poverty
In terms of female poverty, the demographic groups most similar to Uruguayans are Hawaiian (13.6%, a difference of 0.010%), Immigrants from Venezuela (13.6%, a difference of 0.11%), Immigrants from Portugal (13.6%, a difference of 0.17%), Immigrants from Cameroon (13.5%, a difference of 0.22%), and Immigrants from Sierra Leone (13.5%, a difference of 0.33%).
| Demographics | Rating | Rank | Female Poverty |
| Immigrants | Colombia | 44.5 /100 | #182 | Average 13.5% |
| Kenyans | 43.8 /100 | #183 | Average 13.5% |
| Immigrants | Sierra Leone | 43.2 /100 | #184 | Average 13.5% |
| Immigrants | Cameroon | 42.0 /100 | #185 | Average 13.5% |
| Immigrants | Portugal | 41.5 /100 | #186 | Average 13.6% |
| Immigrants | Venezuela | 41.0 /100 | #187 | Average 13.6% |
| Hawaiians | 39.9 /100 | #188 | Fair 13.6% |
| Uruguayans | 39.8 /100 | #189 | Fair 13.6% |
| Sierra Leoneans | 33.1 /100 | #190 | Fair 13.7% |
| Immigrants | Kuwait | 32.7 /100 | #191 | Fair 13.7% |
| Immigrants | Costa Rica | 31.9 /100 | #192 | Fair 13.7% |
| Iraqis | 31.8 /100 | #193 | Fair 13.7% |
| Delaware | 31.1 /100 | #194 | Fair 13.7% |
| Immigrants | South America | 30.6 /100 | #195 | Fair 13.7% |
| South American Indians | 28.9 /100 | #196 | Fair 13.7% |