Haitian vs Immigrants from India Single Mother Poverty

COMPARE

Haitian
Race
Ancestry
AfghanAfricanAlaska NativeAlaskan AthabascanAlbanianAleutAlsatianAmericanApacheArabArapahoArgentineanArmenianAssyrian/Chaldean/SyriacAustralianAustrianBahamianBangladeshiBarbadianBasqueBelgianBelizeanBermudanBhutaneseBlackfeetBolivianBrazilianBritishBritish West IndianBulgarianBurmeseCajunCambodianCanadianCape VerdeanCarpatho RusynCelticCentral AmericanCentral American IndianCherokeeCheyenneChickasawChileanChineseChippewaChoctawColombianColvilleComancheCosta RicanCreeCreekCroatianCrowCubanCypriotCzechCzechoslovakianDanishDelawareDominicanDutchDutch West IndianEastern EuropeanEcuadorianEgyptianEnglishEstonianEthiopianEuropeanFijianFilipinoFinnishFrenchFrench American IndianFrench CanadianGermanGerman RussianGhanaianGreekGuamanian/ChamorroGuatemalanGuyaneseHaitianHmongHonduranHopiHoumaHungarianIcelanderIndian (Asian)IndonesianInupiatIranianIraqiIrishIroquoisIsraeliItalianJamaicanJapaneseJordanianKenyanKiowaKoreanLaotianLatvianLebaneseLiberianLithuanianLumbeeLuxembourgerMacedonianMalaysianMalteseMarshalleseMenomineeMexicanMexican American IndianMongolianMoroccanNative HawaiianNavajoNepaleseNew ZealanderNicaraguanNigerianNorthern EuropeanNorwegianOkinawanOsageOttawaPaiutePakistaniPalestinianPanamanianParaguayanPennsylvania GermanPeruvianPimaPolishPortuguesePotawatomiPuebloPuerto RicanPuget Sound SalishRomanianRussianSalvadoranSamoanScandinavianScotch-IrishScottishSeminoleSenegaleseSerbianShoshoneSierra LeoneanSiouxSlavicSlovakSloveneSomaliSouth AfricanSouth AmericanSouth American IndianSoviet UnionSpaniardSpanishSpanish AmericanSpanish American IndianSri LankanSubsaharan AfricanSudaneseSwedishSwissSyrianTaiwaneseThaiTlingit-HaidaTohono O'OdhamTonganTrinidadian and TobagonianTsimshianTurkishU.S. Virgin IslanderUgandanUkrainianUruguayanUteVenezuelanVietnameseWelshWest IndianYakamaYaquiYugoslavianYumanYup'ikZimbabwean
Immigration
NonimmigrantsImmigrantsAfghanistanAfricaAlbaniaArgentinaArmeniaAsiaAustraliaAustriaBahamasBangladeshBarbadosBelarusBelgiumBelizeBoliviaBosnia and HerzegovinaBrazilBulgariaBurma/MyanmarCabo VerdeCambodiaCameroonCanadaCaribbeanCentral AmericaChileChinaColombiaCongoCosta RicaCroatiaCubaCzechoslovakiaDenmarkDominicaDominican RepublicEastern AfricaEastern AsiaEastern EuropeEcuadorEgyptEl SalvadorEnglandEritreaEthiopiaEuropeFijiFranceGermanyGhanaGreeceGrenadaGuatemalaGuyanaHaitiHondurasHong KongHungaryIndonesiaIranIraqIrelandIsraelItalyJamaicaJapanJordanKazakhstanKenyaKoreaKuwaitLaosLatin AmericaLatviaLebanonLiberiaLithuaniaMalaysiaMexicoMicronesiaMiddle AfricaMoldovaMoroccoNepalNetherlandsNicaraguaNigeriaNorth AmericaNorth MacedoniaNorthern AfricaNorthern EuropeNorwayOceaniaPakistanPanamaPeruPhilippinesPolandPortugalRomaniaRussiaSaudi ArabiaScotlandSenegalSerbiaSierra LeoneSingaporeSomaliaSouth AfricaSouth AmericaSouth Central AsiaSouth Eastern AsiaSouthern EuropeSpainSri LankaSt. Vincent and the GrenadinesSudanSwedenSwitzerlandSyriaTaiwanThailandTrinidad and TobagoTurkeyUgandaUkraineUruguayUzbekistanVenezuelaVietnamWest IndiesWestern AfricaWestern AsiaWestern EuropeYemenZaireZimbabweAzores
Immigrants from India
Race
Ancestry
AfghanAfricanAlaska NativeAlaskan AthabascanAlbanianAleutAlsatianAmericanApacheArabArapahoArgentineanArmenianAssyrian/Chaldean/SyriacAustralianAustrianBahamianBangladeshiBarbadianBasqueBelgianBelizeanBermudanBhutaneseBlackfeetBolivianBrazilianBritishBritish West IndianBulgarianBurmeseCajunCambodianCanadianCape VerdeanCarpatho RusynCelticCentral AmericanCentral American IndianCherokeeCheyenneChickasawChileanChineseChippewaChoctawColombianColvilleComancheCosta RicanCreeCreekCroatianCrowCubanCypriotCzechCzechoslovakianDanishDelawareDominicanDutchDutch West IndianEastern EuropeanEcuadorianEgyptianEnglishEstonianEthiopianEuropeanFijianFilipinoFinnishFrenchFrench American IndianFrench CanadianGermanGerman RussianGhanaianGreekGuamanian/ChamorroGuatemalanGuyaneseHmongHonduranHopiHoumaHungarianIcelanderIndian (Asian)IndonesianInupiatIranianIraqiIrishIroquoisIsraeliItalianJamaicanJapaneseJordanianKenyanKiowaKoreanLaotianLatvianLebaneseLiberianLithuanianLumbeeLuxembourgerMacedonianMalaysianMalteseMarshalleseMenomineeMexicanMexican American IndianMongolianMoroccanNative HawaiianNavajoNepaleseNew ZealanderNicaraguanNigerianNorthern EuropeanNorwegianOkinawanOsageOttawaPaiutePakistaniPalestinianPanamanianParaguayanPennsylvania GermanPeruvianPimaPolishPortuguesePotawatomiPuebloPuerto RicanPuget Sound SalishRomanianRussianSalvadoranSamoanScandinavianScotch-IrishScottishSeminoleSenegaleseSerbianShoshoneSierra LeoneanSiouxSlavicSlovakSloveneSomaliSouth AfricanSouth AmericanSouth American IndianSoviet UnionSpaniardSpanishSpanish AmericanSpanish American IndianSri LankanSubsaharan AfricanSudaneseSwedishSwissSyrianTaiwaneseThaiTlingit-HaidaTohono O'OdhamTonganTrinidadian and TobagonianTsimshianTurkishU.S. Virgin IslanderUgandanUkrainianUruguayanUteVenezuelanVietnameseWelshWest IndianYakamaYaquiYugoslavianYumanYup'ikZimbabwean
Immigration
NonimmigrantsImmigrantsAfghanistanAfricaAlbaniaArgentinaArmeniaAsiaAustraliaAustriaBahamasBangladeshBarbadosBelarusBelgiumBelizeBoliviaBosnia and HerzegovinaBrazilBulgariaBurma/MyanmarCabo VerdeCambodiaCameroonCanadaCaribbeanCentral AmericaChileChinaColombiaCongoCosta RicaCroatiaCubaCzechoslovakiaDenmarkDominicaDominican RepublicEastern AfricaEastern AsiaEastern EuropeEcuadorEgyptEl SalvadorEnglandEritreaEthiopiaEuropeFijiFranceGermanyGhanaGreeceGrenadaGuatemalaGuyanaHaitiHondurasHong KongHungaryIndiaIndonesiaIranIraqIrelandIsraelItalyJamaicaJapanJordanKazakhstanKenyaKoreaKuwaitLaosLatin AmericaLatviaLebanonLiberiaLithuaniaMalaysiaMexicoMicronesiaMiddle AfricaMoldovaMoroccoNepalNetherlandsNicaraguaNigeriaNorth AmericaNorth MacedoniaNorthern AfricaNorthern EuropeNorwayOceaniaPakistanPanamaPeruPhilippinesPolandPortugalRomaniaRussiaSaudi ArabiaScotlandSenegalSerbiaSierra LeoneSingaporeSomaliaSouth AfricaSouth AmericaSouth Central AsiaSouth Eastern AsiaSouthern EuropeSpainSri LankaSt. Vincent and the GrenadinesSudanSwedenSwitzerlandSyriaTaiwanThailandTrinidad and TobagoTurkeyUgandaUkraineUruguayUzbekistanVenezuelaVietnamWest IndiesWestern AfricaWestern AsiaWestern EuropeYemenZaireZimbabweAzores
Single Mother Poverty
Income
Poverty
Unemployment
Labor Participation
Family Structure
Vehicle Availability
Education Level
Disability

Single Mother Poverty Comparison

Haitians

Immigrants from India

Poor
Exceptional
29.8%
SINGLE MOTHER POVERTY
13.3/ 100
METRIC RATING
210th/ 347
METRIC RANK
23.8%
SINGLE MOTHER POVERTY
100.0/ 100
METRIC RATING
2nd/ 347
METRIC RANK

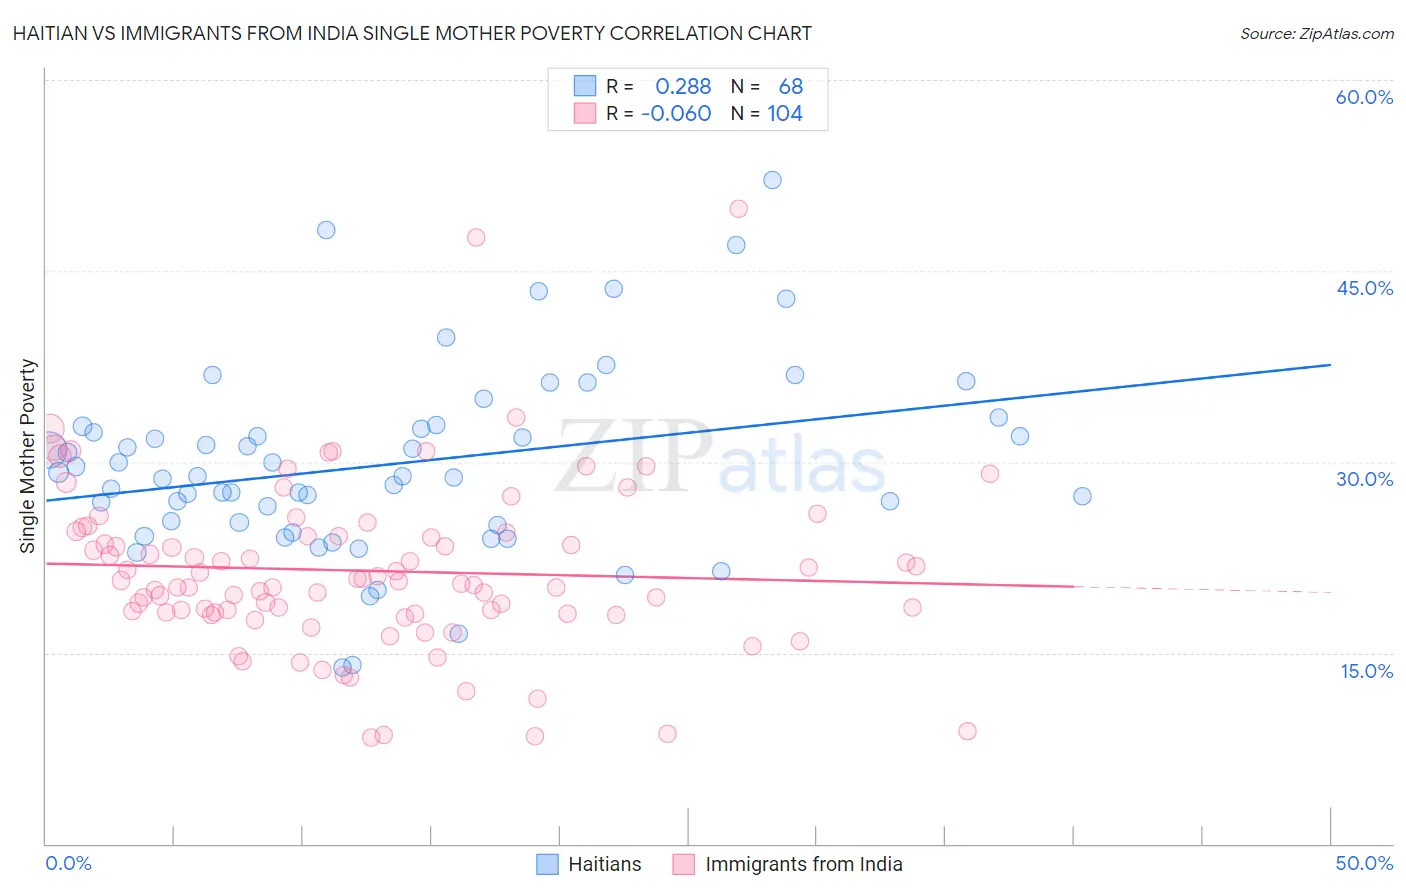
Haitian vs Immigrants from India Single Mother Poverty Correlation Chart

The statistical analysis conducted on geographies consisting of 283,035,153 people shows a weak positive correlation between the proportion of Haitians and poverty level among single mothers in the United States with a correlation coefficient (R) of 0.288 and weighted average of 29.8%. Similarly, the statistical analysis conducted on geographies consisting of 420,975,402 people shows a slight negative correlation between the proportion of Immigrants from India and poverty level among single mothers in the United States with a correlation coefficient (R) of -0.060 and weighted average of 23.8%, a difference of 25.3%.
Haitian vs Immigrants from India Single Mother Poverty

Single Mother Poverty Correlation Summary

MeasurementHaitianImmigrants from India
Minimum13.8%8.3%
Maximum52.2%49.8%
Range38.4%41.5%
Mean29.8%21.4%
Median28.8%20.5%
Interquartile 25% (IQ1)25.1%18.1%
Interquartile 75% (IQ3)32.7%24.3%
Interquartile Range (IQR)7.6%6.2%
Standard Deviation (Sample)7.4%6.7%
Standard Deviation (Population)7.4%6.7%

Similar Demographics by Single Mother Poverty

Demographics Similar to Haitians by Single Mother Poverty

In terms of single mother poverty, the demographic groups most similar to Haitians are Guyanese (29.8%, a difference of 0.050%), Irish (29.8%, a difference of 0.060%), Nicaraguan (29.8%, a difference of 0.090%), Immigrants from Guyana (29.8%, a difference of 0.14%), and Immigrants from Thailand (29.9%, a difference of 0.14%).
DemographicsRating | RankSingle Mother Poverty
Swiss
17.2
/100
|
#203
Poor
29.7%
Immigrants | Immigrants
16.6
/100
|
#204
Poor
29.7%
Czechoslovakians
16.1
/100
|
#205
Poor
29.7%
Immigrants | Haiti
15.8
/100
|
#206
Poor
29.7%
Immigrants | Panama
15.5
/100
|
#207
Poor
29.8%
Immigrants | Guyana
14.7
/100
|
#208
Poor
29.8%
Irish
13.9
/100
|
#209
Poor
29.8%
Haitians
13.3
/100
|
#210
Poor
29.8%
Guyanese
12.8
/100
|
#211
Poor
29.8%
Nicaraguans
12.4
/100
|
#212
Poor
29.8%
Immigrants | Thailand
12.0
/100
|
#213
Poor
29.9%
Liberians
11.7
/100
|
#214
Poor
29.9%
Jamaicans
11.7
/100
|
#215
Poor
29.9%
Immigrants | Western Africa
11.5
/100
|
#216
Poor
29.9%
Immigrants | Ghana
11.3
/100
|
#217
Poor
29.9%

Demographics Similar to Immigrants from India by Single Mother Poverty

In terms of single mother poverty, the demographic groups most similar to Immigrants from India are Assyrian/Chaldean/Syriac (23.8%, a difference of 0.020%), Immigrants from Taiwan (23.9%, a difference of 0.20%), Filipino (24.3%, a difference of 2.1%), Immigrants from Hong Kong (24.4%, a difference of 2.4%), and Thai (24.5%, a difference of 2.9%).
DemographicsRating | RankSingle Mother Poverty
Assyrians/Chaldeans/Syriacs
100.0
/100
|
#1
Exceptional
23.8%
Immigrants | India
100.0
/100
|
#2
Exceptional
23.8%
Immigrants | Taiwan
100.0
/100
|
#3
Exceptional
23.9%
Filipinos
100.0
/100
|
#4
Exceptional
24.3%
Immigrants | Hong Kong
100.0
/100
|
#5
Exceptional
24.4%
Thais
100.0
/100
|
#6
Exceptional
24.5%
Chinese
100.0
/100
|
#7
Exceptional
24.6%
Immigrants | Iran
100.0
/100
|
#8
Exceptional
25.1%
Immigrants | Lithuania
100.0
/100
|
#9
Exceptional
25.2%
Immigrants | South Central Asia
100.0
/100
|
#10
Exceptional
25.3%
Iranians
100.0
/100
|
#11
Exceptional
25.5%
Bhutanese
100.0
/100
|
#12
Exceptional
25.6%
Indians (Asian)
100.0
/100
|
#13
Exceptional
25.8%
Immigrants | Singapore
100.0
/100
|
#14
Exceptional
25.8%
Immigrants | Ireland
100.0
/100
|
#15
Exceptional
25.8%