Greek vs Immigrants from Ireland Seniors Poverty Over the Age of 75

COMPARE

Greek
Race
Ancestry
AfghanAfricanAlaska NativeAlaskan AthabascanAlbanianAleutAlsatianAmericanApacheArabArapahoArgentineanArmenianAssyrian/Chaldean/SyriacAustralianAustrianBahamianBangladeshiBarbadianBasqueBelgianBelizeanBermudanBhutaneseBlackfeetBolivianBrazilianBritishBritish West IndianBulgarianBurmeseCajunCambodianCanadianCape VerdeanCarpatho RusynCelticCentral AmericanCentral American IndianCherokeeCheyenneChickasawChileanChineseChippewaChoctawColombianColvilleComancheCosta RicanCreeCreekCroatianCrowCubanCypriotCzechCzechoslovakianDanishDelawareDominicanDutchDutch West IndianEastern EuropeanEcuadorianEgyptianEnglishEstonianEthiopianEuropeanFijianFilipinoFinnishFrenchFrench American IndianFrench CanadianGermanGerman RussianGhanaianGreekGuamanian/ChamorroGuatemalanGuyaneseHaitianHmongHonduranHopiHoumaHungarianIcelanderIndian (Asian)IndonesianInupiatIranianIraqiIrishIroquoisIsraeliItalianJamaicanJapaneseJordanianKenyanKiowaKoreanLaotianLatvianLebaneseLiberianLithuanianLumbeeLuxembourgerMacedonianMalaysianMalteseMarshalleseMenomineeMexicanMexican American IndianMongolianMoroccanNative HawaiianNavajoNepaleseNew ZealanderNicaraguanNigerianNorthern EuropeanNorwegianOkinawanOsageOttawaPaiutePakistaniPalestinianPanamanianParaguayanPennsylvania GermanPeruvianPimaPolishPortuguesePotawatomiPuebloPuerto RicanPuget Sound SalishRomanianRussianSalvadoranSamoanScandinavianScotch-IrishScottishSeminoleSenegaleseSerbianShoshoneSierra LeoneanSiouxSlavicSlovakSloveneSomaliSouth AfricanSouth AmericanSouth American IndianSoviet UnionSpaniardSpanishSpanish AmericanSpanish American IndianSri LankanSubsaharan AfricanSudaneseSwedishSwissSyrianTaiwaneseThaiTlingit-HaidaTohono O'OdhamTonganTrinidadian and TobagonianTsimshianTurkishU.S. Virgin IslanderUgandanUkrainianUruguayanUteVenezuelanVietnameseWelshWest IndianYakamaYaquiYugoslavianYumanYup'ikZimbabwean
Immigration
NonimmigrantsImmigrantsAfghanistanAfricaAlbaniaArgentinaArmeniaAsiaAustraliaAustriaBahamasBangladeshBarbadosBelarusBelgiumBelizeBoliviaBosnia and HerzegovinaBrazilBulgariaBurma/MyanmarCabo VerdeCambodiaCameroonCanadaCaribbeanCentral AmericaChileChinaColombiaCongoCosta RicaCroatiaCubaCzechoslovakiaDenmarkDominicaDominican RepublicEastern AfricaEastern AsiaEastern EuropeEcuadorEgyptEl SalvadorEnglandEritreaEthiopiaEuropeFijiFranceGermanyGhanaGreeceGrenadaGuatemalaGuyanaHaitiHondurasHong KongHungaryIndiaIndonesiaIranIraqIsraelItalyJamaicaJapanJordanKazakhstanKenyaKoreaKuwaitLaosLatin AmericaLatviaLebanonLiberiaLithuaniaMalaysiaMexicoMicronesiaMiddle AfricaMoldovaMoroccoNepalNetherlandsNicaraguaNigeriaNorth AmericaNorth MacedoniaNorthern AfricaNorthern EuropeNorwayOceaniaPakistanPanamaPeruPhilippinesPolandPortugalRomaniaRussiaSaudi ArabiaScotlandSenegalSerbiaSierra LeoneSingaporeSomaliaSouth AfricaSouth AmericaSouth Central AsiaSouth Eastern AsiaSouthern EuropeSpainSri LankaSt. Vincent and the GrenadinesSudanSwedenSwitzerlandSyriaTaiwanThailandTrinidad and TobagoTurkeyUgandaUkraineUruguayUzbekistanVenezuelaVietnamWest IndiesWestern AfricaWestern AsiaWestern EuropeYemenZaireZimbabweAzores
Immigrants from Ireland
Race
Ancestry
AfghanAfricanAlaska NativeAlaskan AthabascanAlbanianAleutAlsatianAmericanApacheArabArapahoArgentineanArmenianAssyrian/Chaldean/SyriacAustralianAustrianBahamianBangladeshiBarbadianBasqueBelgianBelizeanBermudanBhutaneseBlackfeetBolivianBrazilianBritishBritish West IndianBulgarianBurmeseCajunCambodianCanadianCape VerdeanCarpatho RusynCelticCentral AmericanCentral American IndianCherokeeCheyenneChickasawChileanChineseChippewaChoctawColombianColvilleComancheCosta RicanCreeCreekCroatianCrowCubanCypriotCzechCzechoslovakianDanishDelawareDominicanDutchDutch West IndianEastern EuropeanEcuadorianEgyptianEnglishEstonianEthiopianEuropeanFijianFilipinoFinnishFrenchFrench American IndianFrench CanadianGermanGerman RussianGhanaianGuamanian/ChamorroGuatemalanGuyaneseHaitianHmongHonduranHopiHoumaHungarianIcelanderIndian (Asian)IndonesianInupiatIranianIraqiIrishIroquoisIsraeliItalianJamaicanJapaneseJordanianKenyanKiowaKoreanLaotianLatvianLebaneseLiberianLithuanianLumbeeLuxembourgerMacedonianMalaysianMalteseMarshalleseMenomineeMexicanMexican American IndianMongolianMoroccanNative HawaiianNavajoNepaleseNew ZealanderNicaraguanNigerianNorthern EuropeanNorwegianOkinawanOsageOttawaPaiutePakistaniPalestinianPanamanianParaguayanPennsylvania GermanPeruvianPimaPolishPortuguesePotawatomiPuebloPuerto RicanPuget Sound SalishRomanianRussianSalvadoranSamoanScandinavianScotch-IrishScottishSeminoleSenegaleseSerbianShoshoneSierra LeoneanSiouxSlavicSlovakSloveneSomaliSouth AfricanSouth AmericanSouth American IndianSoviet UnionSpaniardSpanishSpanish AmericanSpanish American IndianSri LankanSubsaharan AfricanSudaneseSwedishSwissSyrianTaiwaneseThaiTlingit-HaidaTohono O'OdhamTonganTrinidadian and TobagonianTsimshianTurkishU.S. Virgin IslanderUgandanUkrainianUruguayanUteVenezuelanVietnameseWelshWest IndianYakamaYaquiYugoslavianYumanYup'ikZimbabwean
Immigration
NonimmigrantsImmigrantsAfghanistanAfricaAlbaniaArgentinaArmeniaAsiaAustraliaAustriaBahamasBangladeshBarbadosBelarusBelgiumBelizeBoliviaBosnia and HerzegovinaBrazilBulgariaBurma/MyanmarCabo VerdeCambodiaCameroonCanadaCaribbeanCentral AmericaChileChinaColombiaCongoCosta RicaCroatiaCubaCzechoslovakiaDenmarkDominicaDominican RepublicEastern AfricaEastern AsiaEastern EuropeEcuadorEgyptEl SalvadorEnglandEritreaEthiopiaEuropeFijiFranceGermanyGhanaGreeceGrenadaGuatemalaGuyanaHaitiHondurasHong KongHungaryIndiaIndonesiaIranIraqIrelandIsraelItalyJamaicaJapanJordanKazakhstanKenyaKoreaKuwaitLaosLatin AmericaLatviaLebanonLiberiaLithuaniaMalaysiaMexicoMicronesiaMiddle AfricaMoldovaMoroccoNepalNetherlandsNicaraguaNigeriaNorth AmericaNorth MacedoniaNorthern AfricaNorthern EuropeNorwayOceaniaPakistanPanamaPeruPhilippinesPolandPortugalRomaniaRussiaSaudi ArabiaScotlandSenegalSerbiaSierra LeoneSingaporeSomaliaSouth AfricaSouth AmericaSouth Central AsiaSouth Eastern AsiaSouthern EuropeSpainSri LankaSt. Vincent and the GrenadinesSudanSwedenSwitzerlandSyriaTaiwanThailandTrinidad and TobagoTurkeyUgandaUkraineUruguayUzbekistanVenezuelaVietnamWest IndiesWestern AfricaWestern AsiaWestern EuropeYemenZaireZimbabweAzores
Seniors Poverty Over the Age of 75
Income
Poverty
Unemployment
Labor Participation
Family Structure
Vehicle Availability
Education Level
Disability

Seniors Poverty Over the Age of 75 Comparison

Greeks

Immigrants from Ireland

Exceptional
Good
11.1%
SENIORS POVERTY OVER THE AGE OF 75
99.0/ 100
METRIC RATING
46th/ 347
METRIC RANK
11.9%
SENIORS POVERTY OVER THE AGE OF 75
76.2/ 100
METRIC RATING
135th/ 347
METRIC RANK

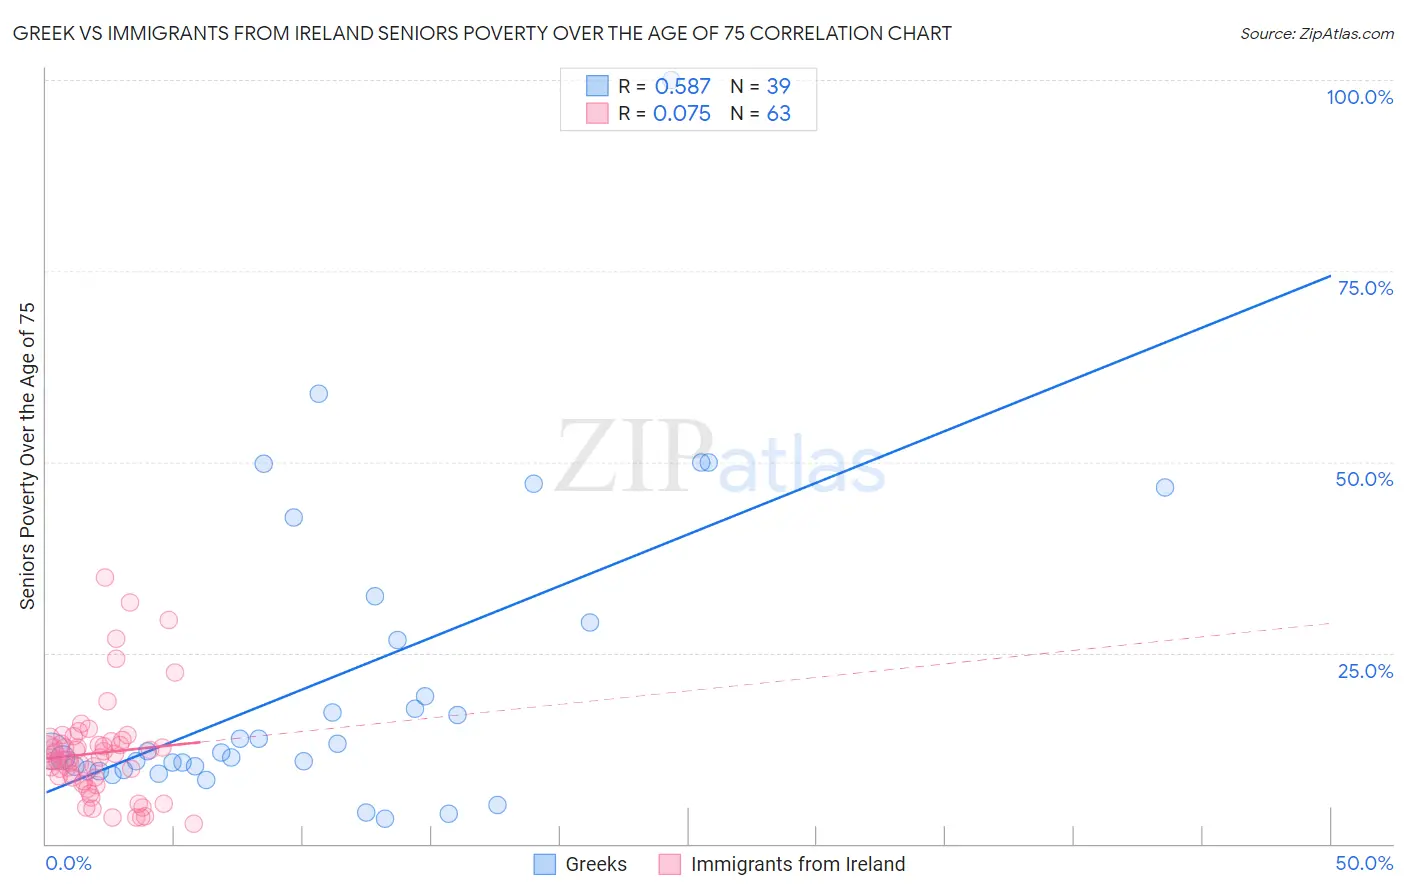
Greek vs Immigrants from Ireland Seniors Poverty Over the Age of 75 Correlation Chart

The statistical analysis conducted on geographies consisting of 474,334,597 people shows a substantial positive correlation between the proportion of Greeks and poverty level among seniors over the age of 75 in the United States with a correlation coefficient (R) of 0.587 and weighted average of 11.1%. Similarly, the statistical analysis conducted on geographies consisting of 239,114,347 people shows a slight positive correlation between the proportion of Immigrants from Ireland and poverty level among seniors over the age of 75 in the United States with a correlation coefficient (R) of 0.075 and weighted average of 11.9%, a difference of 7.6%.
Greek vs Immigrants from Ireland Seniors Poverty Over the Age of 75

Seniors Poverty Over the Age of 75 Correlation Summary

MeasurementGreekImmigrants from Ireland
Minimum3.3%2.6%
Maximum100.0%34.8%
Range96.7%32.2%
Mean21.5%11.9%
Median12.1%11.1%
Interquartile 25% (IQ1)9.7%8.2%
Interquartile 75% (IQ3)29.0%13.4%
Interquartile Range (IQR)19.3%5.2%
Standard Deviation (Sample)20.2%6.5%
Standard Deviation (Population)19.9%6.5%

Similar Demographics by Seniors Poverty Over the Age of 75

Demographics Similar to Greeks by Seniors Poverty Over the Age of 75

In terms of seniors poverty over the age of 75, the demographic groups most similar to Greeks are Carpatho Rusyn (11.1%, a difference of 0.060%), Belgian (11.0%, a difference of 0.33%), Celtic (11.0%, a difference of 0.36%), Austrian (11.0%, a difference of 0.42%), and Hawaiian (11.1%, a difference of 0.44%).
DemographicsRating | RankSeniors Poverty Over the Age of 75
Czechoslovakians
99.4
/100
|
#39
Exceptional
10.9%
Thais
99.4
/100
|
#40
Exceptional
10.9%
Immigrants | Lithuania
99.2
/100
|
#41
Exceptional
11.0%
Austrians
99.1
/100
|
#42
Exceptional
11.0%
Celtics
99.1
/100
|
#43
Exceptional
11.0%
Belgians
99.1
/100
|
#44
Exceptional
11.0%
Carpatho Rusyns
99.0
/100
|
#45
Exceptional
11.1%
Greeks
99.0
/100
|
#46
Exceptional
11.1%
Hawaiians
98.8
/100
|
#47
Exceptional
11.1%
French
98.7
/100
|
#48
Exceptional
11.1%
Samoans
98.7
/100
|
#49
Exceptional
11.1%
Serbians
98.6
/100
|
#50
Exceptional
11.1%
Immigrants | North Macedonia
98.6
/100
|
#51
Exceptional
11.1%
Zimbabweans
98.5
/100
|
#52
Exceptional
11.2%
Immigrants | England
98.4
/100
|
#53
Exceptional
11.2%

Demographics Similar to Immigrants from Ireland by Seniors Poverty Over the Age of 75

In terms of seniors poverty over the age of 75, the demographic groups most similar to Immigrants from Ireland are Ugandan (11.9%, a difference of 0.10%), Immigrants from Philippines (11.9%, a difference of 0.14%), Immigrants from Sierra Leone (11.9%, a difference of 0.16%), Immigrants from Moldova (11.9%, a difference of 0.23%), and Lebanese (11.9%, a difference of 0.25%).
DemographicsRating | RankSeniors Poverty Over the Age of 75
Immigrants | Hungary
81.7
/100
|
#128
Excellent
11.8%
Ethiopians
80.7
/100
|
#129
Excellent
11.8%
Spanish
80.5
/100
|
#130
Excellent
11.8%
Immigrants | Western Europe
79.6
/100
|
#131
Good
11.9%
Lebanese
78.3
/100
|
#132
Good
11.9%
Immigrants | Sierra Leone
77.6
/100
|
#133
Good
11.9%
Ugandans
77.1
/100
|
#134
Good
11.9%
Immigrants | Ireland
76.2
/100
|
#135
Good
11.9%
Immigrants | Philippines
75.0
/100
|
#136
Good
11.9%
Immigrants | Moldova
74.1
/100
|
#137
Good
11.9%
Immigrants | Romania
72.6
/100
|
#138
Good
11.9%
Immigrants | Kenya
72.6
/100
|
#139
Good
11.9%
Immigrants | Pakistan
71.9
/100
|
#140
Good
12.0%
Immigrants | Cameroon
71.7
/100
|
#141
Good
12.0%
Immigrants | Laos
71.5
/100
|
#142
Good
12.0%