French vs Immigrants from Senegal Child Poverty Under the Age of 16

COMPARE

French
Race
Ancestry
AfghanAfricanAlaska NativeAlaskan AthabascanAlbanianAleutAlsatianAmericanApacheArabArapahoArgentineanArmenianAssyrian/Chaldean/SyriacAustralianAustrianBahamianBangladeshiBarbadianBasqueBelgianBelizeanBermudanBhutaneseBlackfeetBolivianBrazilianBritishBritish West IndianBulgarianBurmeseCajunCambodianCanadianCape VerdeanCarpatho RusynCelticCentral AmericanCentral American IndianCherokeeCheyenneChickasawChileanChineseChippewaChoctawColombianColvilleComancheCosta RicanCreeCreekCroatianCrowCubanCypriotCzechCzechoslovakianDanishDelawareDominicanDutchDutch West IndianEastern EuropeanEcuadorianEgyptianEnglishEstonianEthiopianEuropeanFijianFilipinoFinnishFrenchFrench American IndianFrench CanadianGermanGerman RussianGhanaianGreekGuamanian/ChamorroGuatemalanGuyaneseHaitianHmongHonduranHopiHoumaHungarianIcelanderIndian (Asian)IndonesianInupiatIranianIraqiIrishIroquoisIsraeliItalianJamaicanJapaneseJordanianKenyanKiowaKoreanLaotianLatvianLebaneseLiberianLithuanianLumbeeLuxembourgerMacedonianMalaysianMalteseMarshalleseMenomineeMexicanMexican American IndianMongolianMoroccanNative HawaiianNavajoNepaleseNew ZealanderNicaraguanNigerianNorthern EuropeanNorwegianOkinawanOsageOttawaPaiutePakistaniPalestinianPanamanianParaguayanPennsylvania GermanPeruvianPimaPolishPortuguesePotawatomiPuebloPuerto RicanPuget Sound SalishRomanianRussianSalvadoranSamoanScandinavianScotch-IrishScottishSeminoleSenegaleseSerbianShoshoneSierra LeoneanSiouxSlavicSlovakSloveneSomaliSouth AfricanSouth AmericanSouth American IndianSoviet UnionSpaniardSpanishSpanish AmericanSpanish American IndianSri LankanSubsaharan AfricanSudaneseSwedishSwissSyrianTaiwaneseThaiTlingit-HaidaTohono O'OdhamTonganTrinidadian and TobagonianTsimshianTurkishU.S. Virgin IslanderUgandanUkrainianUruguayanUteVenezuelanVietnameseWelshWest IndianYakamaYaquiYugoslavianYumanYup'ikZimbabwean
Immigration
NonimmigrantsImmigrantsAfghanistanAfricaAlbaniaArgentinaArmeniaAsiaAustraliaAustriaBahamasBangladeshBarbadosBelarusBelgiumBelizeBoliviaBosnia and HerzegovinaBrazilBulgariaBurma/MyanmarCabo VerdeCambodiaCameroonCanadaCaribbeanCentral AmericaChileChinaColombiaCongoCosta RicaCroatiaCubaCzechoslovakiaDenmarkDominicaDominican RepublicEastern AfricaEastern AsiaEastern EuropeEcuadorEgyptEl SalvadorEnglandEritreaEthiopiaEuropeFijiFranceGermanyGhanaGreeceGrenadaGuatemalaGuyanaHaitiHondurasHong KongHungaryIndiaIndonesiaIranIraqIrelandIsraelItalyJamaicaJapanJordanKazakhstanKenyaKoreaKuwaitLaosLatin AmericaLatviaLebanonLiberiaLithuaniaMalaysiaMexicoMicronesiaMiddle AfricaMoldovaMoroccoNepalNetherlandsNicaraguaNigeriaNorth AmericaNorth MacedoniaNorthern AfricaNorthern EuropeNorwayOceaniaPakistanPanamaPeruPhilippinesPolandPortugalRomaniaRussiaSaudi ArabiaScotlandSerbiaSierra LeoneSingaporeSomaliaSouth AfricaSouth AmericaSouth Central AsiaSouth Eastern AsiaSouthern EuropeSpainSri LankaSt. Vincent and the GrenadinesSudanSwedenSwitzerlandSyriaTaiwanThailandTrinidad and TobagoTurkeyUgandaUkraineUruguayUzbekistanVenezuelaVietnamWest IndiesWestern AfricaWestern AsiaWestern EuropeYemenZaireZimbabweAzores
Immigrants from Senegal
Race
Ancestry
AfghanAfricanAlaska NativeAlaskan AthabascanAlbanianAleutAlsatianAmericanApacheArabArapahoArgentineanArmenianAssyrian/Chaldean/SyriacAustralianAustrianBahamianBangladeshiBarbadianBasqueBelgianBelizeanBermudanBhutaneseBlackfeetBolivianBrazilianBritishBritish West IndianBulgarianBurmeseCajunCambodianCanadianCape VerdeanCarpatho RusynCelticCentral AmericanCentral American IndianCherokeeCheyenneChickasawChileanChineseChippewaChoctawColombianColvilleComancheCosta RicanCreeCreekCroatianCrowCubanCypriotCzechCzechoslovakianDanishDelawareDominicanDutchDutch West IndianEastern EuropeanEcuadorianEgyptianEnglishEstonianEthiopianEuropeanFijianFilipinoFinnishFrench American IndianFrench CanadianGermanGerman RussianGhanaianGreekGuamanian/ChamorroGuatemalanGuyaneseHaitianHmongHonduranHopiHoumaHungarianIcelanderIndian (Asian)IndonesianInupiatIranianIraqiIrishIroquoisIsraeliItalianJamaicanJapaneseJordanianKenyanKiowaKoreanLaotianLatvianLebaneseLiberianLithuanianLumbeeLuxembourgerMacedonianMalaysianMalteseMarshalleseMenomineeMexicanMexican American IndianMongolianMoroccanNative HawaiianNavajoNepaleseNew ZealanderNicaraguanNigerianNorthern EuropeanNorwegianOkinawanOsageOttawaPaiutePakistaniPalestinianPanamanianParaguayanPennsylvania GermanPeruvianPimaPolishPortuguesePotawatomiPuebloPuerto RicanPuget Sound SalishRomanianRussianSalvadoranSamoanScandinavianScotch-IrishScottishSeminoleSenegaleseSerbianShoshoneSierra LeoneanSiouxSlavicSlovakSloveneSomaliSouth AfricanSouth AmericanSouth American IndianSoviet UnionSpaniardSpanishSpanish AmericanSpanish American IndianSri LankanSubsaharan AfricanSudaneseSwedishSwissSyrianTaiwaneseThaiTlingit-HaidaTohono O'OdhamTonganTrinidadian and TobagonianTsimshianTurkishU.S. Virgin IslanderUgandanUkrainianUruguayanUteVenezuelanVietnameseWelshWest IndianYakamaYaquiYugoslavianYumanYup'ikZimbabwean
Immigration
NonimmigrantsImmigrantsAfghanistanAfricaAlbaniaArgentinaArmeniaAsiaAustraliaAustriaBahamasBangladeshBarbadosBelarusBelgiumBelizeBoliviaBosnia and HerzegovinaBrazilBulgariaBurma/MyanmarCabo VerdeCambodiaCameroonCanadaCaribbeanCentral AmericaChileChinaColombiaCongoCosta RicaCroatiaCubaCzechoslovakiaDenmarkDominicaDominican RepublicEastern AfricaEastern AsiaEastern EuropeEcuadorEgyptEl SalvadorEnglandEritreaEthiopiaEuropeFijiFranceGermanyGhanaGreeceGrenadaGuatemalaGuyanaHaitiHondurasHong KongHungaryIndiaIndonesiaIranIraqIrelandIsraelItalyJamaicaJapanJordanKazakhstanKenyaKoreaKuwaitLaosLatin AmericaLatviaLebanonLiberiaLithuaniaMalaysiaMexicoMicronesiaMiddle AfricaMoldovaMoroccoNepalNetherlandsNicaraguaNigeriaNorth AmericaNorth MacedoniaNorthern AfricaNorthern EuropeNorwayOceaniaPakistanPanamaPeruPhilippinesPolandPortugalRomaniaRussiaSaudi ArabiaScotlandSenegalSerbiaSierra LeoneSingaporeSomaliaSouth AfricaSouth AmericaSouth Central AsiaSouth Eastern AsiaSouthern EuropeSpainSri LankaSt. Vincent and the GrenadinesSudanSwedenSwitzerlandSyriaTaiwanThailandTrinidad and TobagoTurkeyUgandaUkraineUruguayUzbekistanVenezuelaVietnamWest IndiesWestern AfricaWestern AsiaWestern EuropeYemenZaireZimbabweAzores
Child Poverty Under the Age of 16
Income
Poverty
Unemployment
Labor Participation
Family Structure
Vehicle Availability
Education Level
Disability

Child Poverty Under the Age of 16 Comparison

French

Immigrants from Senegal

Good
Tragic
15.6%
CHILD POVERTY UNDER THE AGE OF 16
78.5/ 100
METRIC RATING
151st/ 347
METRIC RANK
20.6%
CHILD POVERTY UNDER THE AGE OF 16
0.0/ 100
METRIC RATING
293rd/ 347
METRIC RANK

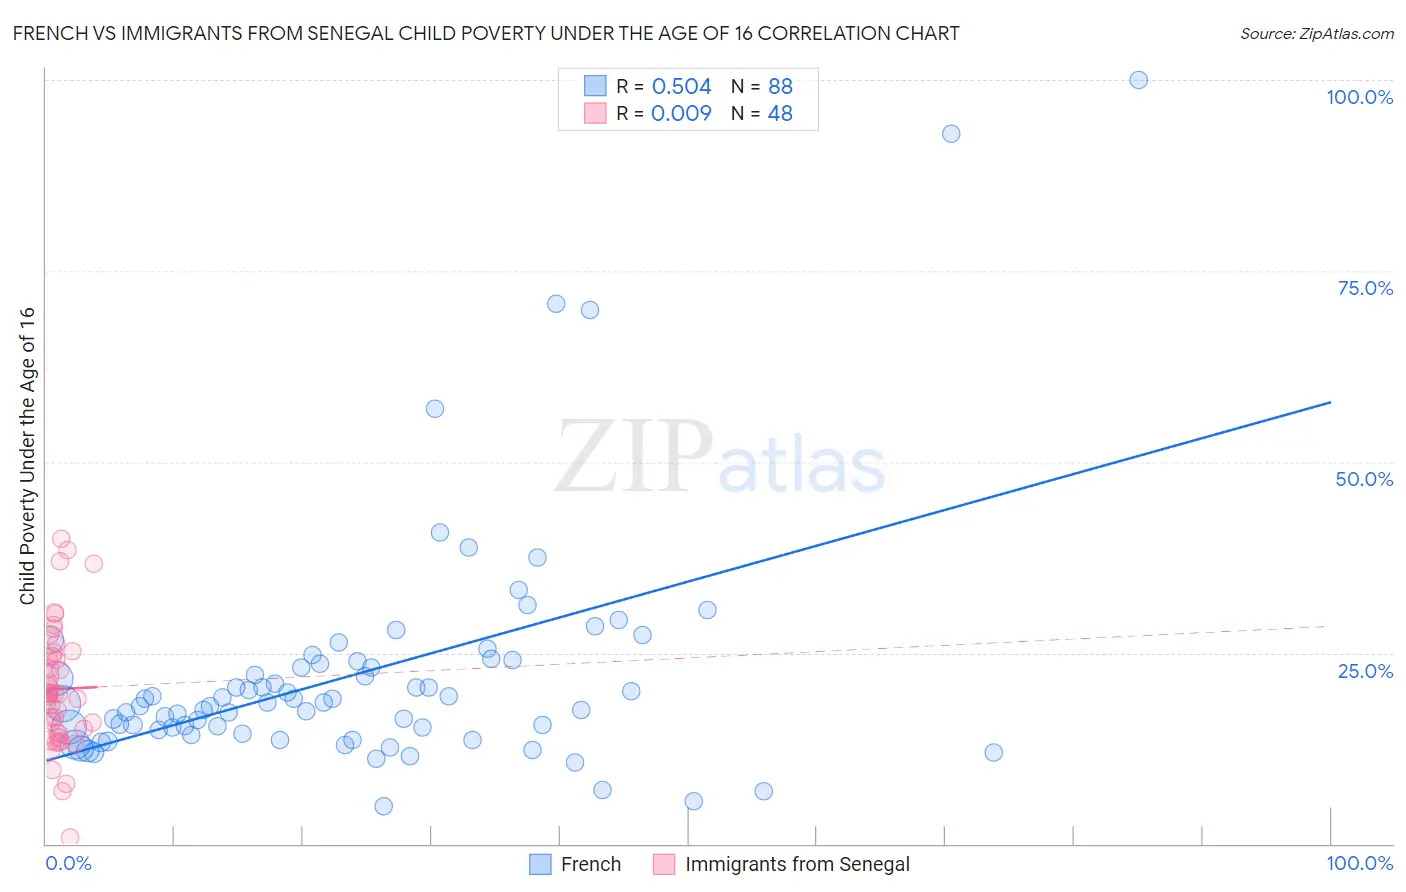
French vs Immigrants from Senegal Child Poverty Under the Age of 16 Correlation Chart

The statistical analysis conducted on geographies consisting of 559,388,012 people shows a substantial positive correlation between the proportion of French and poverty level among children under the age of 16 in the United States with a correlation coefficient (R) of 0.504 and weighted average of 15.6%. Similarly, the statistical analysis conducted on geographies consisting of 90,000,825 people shows no correlation between the proportion of Immigrants from Senegal and poverty level among children under the age of 16 in the United States with a correlation coefficient (R) of 0.009 and weighted average of 20.6%, a difference of 32.4%.
French vs Immigrants from Senegal Child Poverty Under the Age of 16

Child Poverty Under the Age of 16 Correlation Summary

MeasurementFrenchImmigrants from Senegal
Minimum5.0%0.74%
Maximum100.0%40.0%
Range95.0%39.3%
Mean22.2%20.3%
Median18.4%19.6%
Interquartile 25% (IQ1)14.7%14.5%
Interquartile 75% (IQ3)23.7%24.8%
Interquartile Range (IQR)9.0%10.3%
Standard Deviation (Sample)15.8%8.2%
Standard Deviation (Population)15.7%8.1%

Similar Demographics by Child Poverty Under the Age of 16

Demographics Similar to French by Child Poverty Under the Age of 16

In terms of child poverty under the age of 16, the demographic groups most similar to French are Immigrants from Jordan (15.6%, a difference of 0.0%), French Canadian (15.6%, a difference of 0.040%), Venezuelan (15.6%, a difference of 0.18%), Samoan (15.6%, a difference of 0.22%), and Israeli (15.5%, a difference of 0.32%).
DemographicsRating | RankChild Poverty Under the Age of 16
Immigrants | Hungary
81.9
/100
|
#144
Excellent
15.5%
Immigrants | Peru
81.7
/100
|
#145
Excellent
15.5%
Slovaks
81.4
/100
|
#146
Excellent
15.5%
Immigrants | Kuwait
80.5
/100
|
#147
Excellent
15.5%
Puget Sound Salish
80.3
/100
|
#148
Excellent
15.5%
Israelis
80.1
/100
|
#149
Excellent
15.5%
Immigrants | Jordan
78.5
/100
|
#150
Good
15.6%
French
78.5
/100
|
#151
Good
15.6%
French Canadians
78.2
/100
|
#152
Good
15.6%
Venezuelans
77.4
/100
|
#153
Good
15.6%
Samoans
77.3
/100
|
#154
Good
15.6%
Syrians
76.1
/100
|
#155
Good
15.6%
Immigrants | Venezuela
74.9
/100
|
#156
Good
15.7%
Immigrants | Nepal
72.9
/100
|
#157
Good
15.7%
Immigrants | Chile
72.8
/100
|
#158
Good
15.7%

Demographics Similar to Immigrants from Senegal by Child Poverty Under the Age of 16

In terms of child poverty under the age of 16, the demographic groups most similar to Immigrants from Senegal are Haitian (20.7%, a difference of 0.21%), Mexican (20.7%, a difference of 0.34%), Immigrants from Latin America (20.5%, a difference of 0.43%), Chippewa (20.5%, a difference of 0.47%), and Immigrants from Caribbean (20.8%, a difference of 0.73%).
DemographicsRating | RankChild Poverty Under the Age of 16
Immigrants | West Indies
0.0
/100
|
#286
Tragic
20.2%
Blackfeet
0.0
/100
|
#287
Tragic
20.2%
Immigrants | Belize
0.0
/100
|
#288
Tragic
20.3%
Senegalese
0.0
/100
|
#289
Tragic
20.4%
Yaqui
0.0
/100
|
#290
Tragic
20.4%
Chippewa
0.0
/100
|
#291
Tragic
20.5%
Immigrants | Latin America
0.0
/100
|
#292
Tragic
20.5%
Immigrants | Senegal
0.0
/100
|
#293
Tragic
20.6%
Haitians
0.0
/100
|
#294
Tragic
20.7%
Mexicans
0.0
/100
|
#295
Tragic
20.7%
Immigrants | Caribbean
0.0
/100
|
#296
Tragic
20.8%
Hispanics or Latinos
0.0
/100
|
#297
Tragic
20.8%
Arapaho
0.0
/100
|
#298
Tragic
20.8%
Immigrants | Haiti
0.0
/100
|
#299
Tragic
20.9%
Indonesians
0.0
/100
|
#300
Tragic
21.0%