French vs Immigrants from Senegal 12th Grade, No Diploma

COMPARE

French
Race
Ancestry
AfghanAfricanAlaska NativeAlaskan AthabascanAlbanianAleutAlsatianAmericanApacheArabArapahoArgentineanArmenianAssyrian/Chaldean/SyriacAustralianAustrianBahamianBangladeshiBarbadianBasqueBelgianBelizeanBermudanBhutaneseBlackfeetBolivianBrazilianBritishBritish West IndianBulgarianBurmeseCajunCambodianCanadianCape VerdeanCarpatho RusynCelticCentral AmericanCentral American IndianCherokeeCheyenneChickasawChileanChineseChippewaChoctawColombianColvilleComancheCosta RicanCreeCreekCroatianCrowCubanCypriotCzechCzechoslovakianDanishDelawareDominicanDutchDutch West IndianEastern EuropeanEcuadorianEgyptianEnglishEstonianEthiopianEuropeanFijianFilipinoFinnishFrenchFrench American IndianFrench CanadianGermanGerman RussianGhanaianGreekGuamanian/ChamorroGuatemalanGuyaneseHaitianHmongHonduranHopiHoumaHungarianIcelanderIndian (Asian)IndonesianInupiatIranianIraqiIrishIroquoisIsraeliItalianJamaicanJapaneseJordanianKenyanKiowaKoreanLaotianLatvianLebaneseLiberianLithuanianLumbeeLuxembourgerMacedonianMalaysianMalteseMarshalleseMenomineeMexicanMexican American IndianMongolianMoroccanNative HawaiianNavajoNepaleseNew ZealanderNicaraguanNigerianNorthern EuropeanNorwegianOkinawanOsageOttawaPaiutePakistaniPalestinianPanamanianParaguayanPennsylvania GermanPeruvianPimaPolishPortuguesePotawatomiPuebloPuerto RicanPuget Sound SalishRomanianRussianSalvadoranSamoanScandinavianScotch-IrishScottishSeminoleSenegaleseSerbianShoshoneSierra LeoneanSiouxSlavicSlovakSloveneSomaliSouth AfricanSouth AmericanSouth American IndianSoviet UnionSpaniardSpanishSpanish AmericanSpanish American IndianSri LankanSubsaharan AfricanSudaneseSwedishSwissSyrianTaiwaneseThaiTlingit-HaidaTohono O'OdhamTonganTrinidadian and TobagonianTsimshianTurkishU.S. Virgin IslanderUgandanUkrainianUruguayanUteVenezuelanVietnameseWelshWest IndianYakamaYaquiYugoslavianYumanYup'ikZimbabwean
Immigration
NonimmigrantsImmigrantsAfghanistanAfricaAlbaniaArgentinaArmeniaAsiaAustraliaAustriaBahamasBangladeshBarbadosBelarusBelgiumBelizeBoliviaBosnia and HerzegovinaBrazilBulgariaBurma/MyanmarCabo VerdeCambodiaCameroonCanadaCaribbeanCentral AmericaChileChinaColombiaCongoCosta RicaCroatiaCubaCzechoslovakiaDenmarkDominicaDominican RepublicEastern AfricaEastern AsiaEastern EuropeEcuadorEgyptEl SalvadorEnglandEritreaEthiopiaEuropeFijiFranceGermanyGhanaGreeceGrenadaGuatemalaGuyanaHaitiHondurasHong KongHungaryIndiaIndonesiaIranIraqIrelandIsraelItalyJamaicaJapanJordanKazakhstanKenyaKoreaKuwaitLaosLatin AmericaLatviaLebanonLiberiaLithuaniaMalaysiaMexicoMicronesiaMiddle AfricaMoldovaMoroccoNepalNetherlandsNicaraguaNigeriaNorth AmericaNorth MacedoniaNorthern AfricaNorthern EuropeNorwayOceaniaPakistanPanamaPeruPhilippinesPolandPortugalRomaniaRussiaSaudi ArabiaScotlandSerbiaSierra LeoneSingaporeSomaliaSouth AfricaSouth AmericaSouth Central AsiaSouth Eastern AsiaSouthern EuropeSpainSri LankaSt. Vincent and the GrenadinesSudanSwedenSwitzerlandSyriaTaiwanThailandTrinidad and TobagoTurkeyUgandaUkraineUruguayUzbekistanVenezuelaVietnamWest IndiesWestern AfricaWestern AsiaWestern EuropeYemenZaireZimbabweAzores
Immigrants from Senegal
Race
Ancestry
AfghanAfricanAlaska NativeAlaskan AthabascanAlbanianAleutAlsatianAmericanApacheArabArapahoArgentineanArmenianAssyrian/Chaldean/SyriacAustralianAustrianBahamianBangladeshiBarbadianBasqueBelgianBelizeanBermudanBhutaneseBlackfeetBolivianBrazilianBritishBritish West IndianBulgarianBurmeseCajunCambodianCanadianCape VerdeanCarpatho RusynCelticCentral AmericanCentral American IndianCherokeeCheyenneChickasawChileanChineseChippewaChoctawColombianColvilleComancheCosta RicanCreeCreekCroatianCrowCubanCypriotCzechCzechoslovakianDanishDelawareDominicanDutchDutch West IndianEastern EuropeanEcuadorianEgyptianEnglishEstonianEthiopianEuropeanFijianFilipinoFinnishFrench American IndianFrench CanadianGermanGerman RussianGhanaianGreekGuamanian/ChamorroGuatemalanGuyaneseHaitianHmongHonduranHopiHoumaHungarianIcelanderIndian (Asian)IndonesianInupiatIranianIraqiIrishIroquoisIsraeliItalianJamaicanJapaneseJordanianKenyanKiowaKoreanLaotianLatvianLebaneseLiberianLithuanianLumbeeLuxembourgerMacedonianMalaysianMalteseMarshalleseMenomineeMexicanMexican American IndianMongolianMoroccanNative HawaiianNavajoNepaleseNew ZealanderNicaraguanNigerianNorthern EuropeanNorwegianOkinawanOsageOttawaPaiutePakistaniPalestinianPanamanianParaguayanPennsylvania GermanPeruvianPimaPolishPortuguesePotawatomiPuebloPuerto RicanPuget Sound SalishRomanianRussianSalvadoranSamoanScandinavianScotch-IrishScottishSeminoleSenegaleseSerbianShoshoneSierra LeoneanSiouxSlavicSlovakSloveneSomaliSouth AfricanSouth AmericanSouth American IndianSoviet UnionSpaniardSpanishSpanish AmericanSpanish American IndianSri LankanSubsaharan AfricanSudaneseSwedishSwissSyrianTaiwaneseThaiTlingit-HaidaTohono O'OdhamTonganTrinidadian and TobagonianTsimshianTurkishU.S. Virgin IslanderUgandanUkrainianUruguayanUteVenezuelanVietnameseWelshWest IndianYakamaYaquiYugoslavianYumanYup'ikZimbabwean
Immigration
NonimmigrantsImmigrantsAfghanistanAfricaAlbaniaArgentinaArmeniaAsiaAustraliaAustriaBahamasBangladeshBarbadosBelarusBelgiumBelizeBoliviaBosnia and HerzegovinaBrazilBulgariaBurma/MyanmarCabo VerdeCambodiaCameroonCanadaCaribbeanCentral AmericaChileChinaColombiaCongoCosta RicaCroatiaCubaCzechoslovakiaDenmarkDominicaDominican RepublicEastern AfricaEastern AsiaEastern EuropeEcuadorEgyptEl SalvadorEnglandEritreaEthiopiaEuropeFijiFranceGermanyGhanaGreeceGrenadaGuatemalaGuyanaHaitiHondurasHong KongHungaryIndiaIndonesiaIranIraqIrelandIsraelItalyJamaicaJapanJordanKazakhstanKenyaKoreaKuwaitLaosLatin AmericaLatviaLebanonLiberiaLithuaniaMalaysiaMexicoMicronesiaMiddle AfricaMoldovaMoroccoNepalNetherlandsNicaraguaNigeriaNorth AmericaNorth MacedoniaNorthern AfricaNorthern EuropeNorwayOceaniaPakistanPanamaPeruPhilippinesPolandPortugalRomaniaRussiaSaudi ArabiaScotlandSenegalSerbiaSierra LeoneSingaporeSomaliaSouth AfricaSouth AmericaSouth Central AsiaSouth Eastern AsiaSouthern EuropeSpainSri LankaSt. Vincent and the GrenadinesSudanSwedenSwitzerlandSyriaTaiwanThailandTrinidad and TobagoTurkeyUgandaUkraineUruguayUzbekistanVenezuelaVietnamWest IndiesWestern AfricaWestern AsiaWestern EuropeYemenZaireZimbabweAzores
12th Grade, No Diploma
Income
Poverty
Unemployment
Labor Participation
Family Structure
Vehicle Availability
Education Level
Disability

12th Grade, No Diploma Comparison

French

Immigrants from Senegal

Exceptional
Tragic
92.6%
12TH GRADE, NO DIPLOMA
99.4/ 100
METRIC RATING
76th/ 347
METRIC RANK
89.7%
12TH GRADE, NO DIPLOMA
0.5/ 100
METRIC RATING
255th/ 347
METRIC RANK

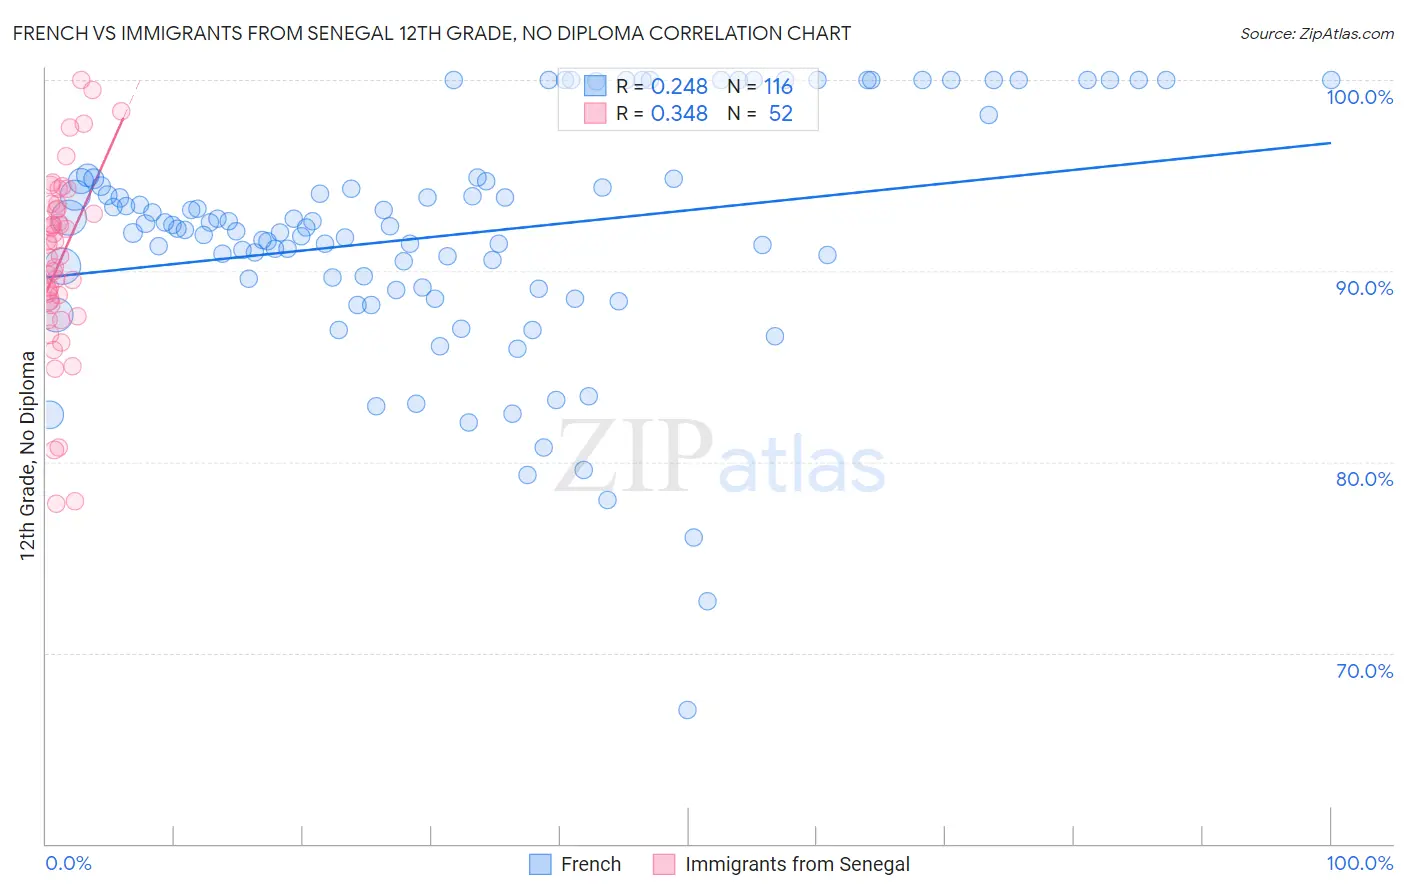
French vs Immigrants from Senegal 12th Grade, No Diploma Correlation Chart

The statistical analysis conducted on geographies consisting of 572,427,471 people shows a weak positive correlation between the proportion of French and percentage of population with at least 12th grade (no diploma) education in the United States with a correlation coefficient (R) of 0.248 and weighted average of 92.6%. Similarly, the statistical analysis conducted on geographies consisting of 90,130,297 people shows a mild positive correlation between the proportion of Immigrants from Senegal and percentage of population with at least 12th grade (no diploma) education in the United States with a correlation coefficient (R) of 0.348 and weighted average of 89.7%, a difference of 3.3%.
French vs Immigrants from Senegal 12th Grade, No Diploma

12th Grade, No Diploma Correlation Summary

MeasurementFrenchImmigrants from Senegal
Minimum67.0%77.8%
Maximum100.0%100.0%
Range33.0%22.2%
Mean91.9%90.5%
Median92.3%91.1%
Interquartile 25% (IQ1)89.4%88.3%
Interquartile 75% (IQ3)94.8%93.4%
Interquartile Range (IQR)5.4%5.0%
Standard Deviation (Sample)6.2%4.8%
Standard Deviation (Population)6.2%4.8%

Similar Demographics by 12th Grade, No Diploma

Demographics Similar to French by 12th Grade, No Diploma

In terms of 12th grade, no diploma, the demographic groups most similar to French are Immigrants from Moldova (92.6%, a difference of 0.0%), Native Hawaiian (92.6%, a difference of 0.0%), Burmese (92.6%, a difference of 0.010%), Immigrants from South Central Asia (92.6%, a difference of 0.020%), and Immigrants from England (92.6%, a difference of 0.020%).
DemographicsRating | Rank12th Grade, No Diploma
Immigrants | Iran
99.5
/100
|
#69
Exceptional
92.7%
Czechoslovakians
99.5
/100
|
#70
Exceptional
92.6%
Immigrants | Latvia
99.5
/100
|
#71
Exceptional
92.6%
Immigrants | South Central Asia
99.5
/100
|
#72
Exceptional
92.6%
Burmese
99.4
/100
|
#73
Exceptional
92.6%
Immigrants | Moldova
99.4
/100
|
#74
Exceptional
92.6%
Native Hawaiians
99.4
/100
|
#75
Exceptional
92.6%
French
99.4
/100
|
#76
Exceptional
92.6%
Immigrants | England
99.4
/100
|
#77
Exceptional
92.6%
Cambodians
99.3
/100
|
#78
Exceptional
92.6%
Romanians
99.3
/100
|
#79
Exceptional
92.6%
French Canadians
99.3
/100
|
#80
Exceptional
92.6%
Immigrants | Denmark
99.2
/100
|
#81
Exceptional
92.5%
Immigrants | Switzerland
99.2
/100
|
#82
Exceptional
92.5%
Immigrants | Israel
99.2
/100
|
#83
Exceptional
92.5%

Demographics Similar to Immigrants from Senegal by 12th Grade, No Diploma

In terms of 12th grade, no diploma, the demographic groups most similar to Immigrants from Senegal are Immigrants from Peru (89.7%, a difference of 0.010%), Immigrants from Ghana (89.7%, a difference of 0.010%), Jamaican (89.7%, a difference of 0.020%), African (89.6%, a difference of 0.060%), and Immigrants from Western Africa (89.6%, a difference of 0.090%).
DemographicsRating | Rank12th Grade, No Diploma
Comanche
1.1
/100
|
#248
Tragic
89.9%
Senegalese
1.1
/100
|
#249
Tragic
89.9%
Immigrants | Eritrea
1.0
/100
|
#250
Tragic
89.9%
Spanish Americans
0.9
/100
|
#251
Tragic
89.9%
Bahamians
0.9
/100
|
#252
Tragic
89.9%
Choctaw
0.7
/100
|
#253
Tragic
89.8%
Immigrants | Peru
0.5
/100
|
#254
Tragic
89.7%
Immigrants | Senegal
0.5
/100
|
#255
Tragic
89.7%
Immigrants | Ghana
0.5
/100
|
#256
Tragic
89.7%
Jamaicans
0.5
/100
|
#257
Tragic
89.7%
Africans
0.4
/100
|
#258
Tragic
89.6%
Immigrants | Western Africa
0.4
/100
|
#259
Tragic
89.6%
Immigrants | South Eastern Asia
0.4
/100
|
#260
Tragic
89.6%
Cheyenne
0.4
/100
|
#261
Tragic
89.6%
Sioux
0.4
/100
|
#262
Tragic
89.6%