French American Indian vs Inupiat Child Poverty Among Girls Under 16
COMPARE
French American Indian
Inupiat
Child Poverty Among Girls Under 16
Child Poverty Among Girls Under 16 Comparison
French American Indians
Inupiat
19.2%
CHILD POVERTY AMONG GIRLS UNDER 16
0.3/ 100
METRIC RATING
248th/ 347
METRIC RANK
20.8%
CHILD POVERTY AMONG GIRLS UNDER 16
0.0/ 100
METRIC RATING
297th/ 347
METRIC RANK
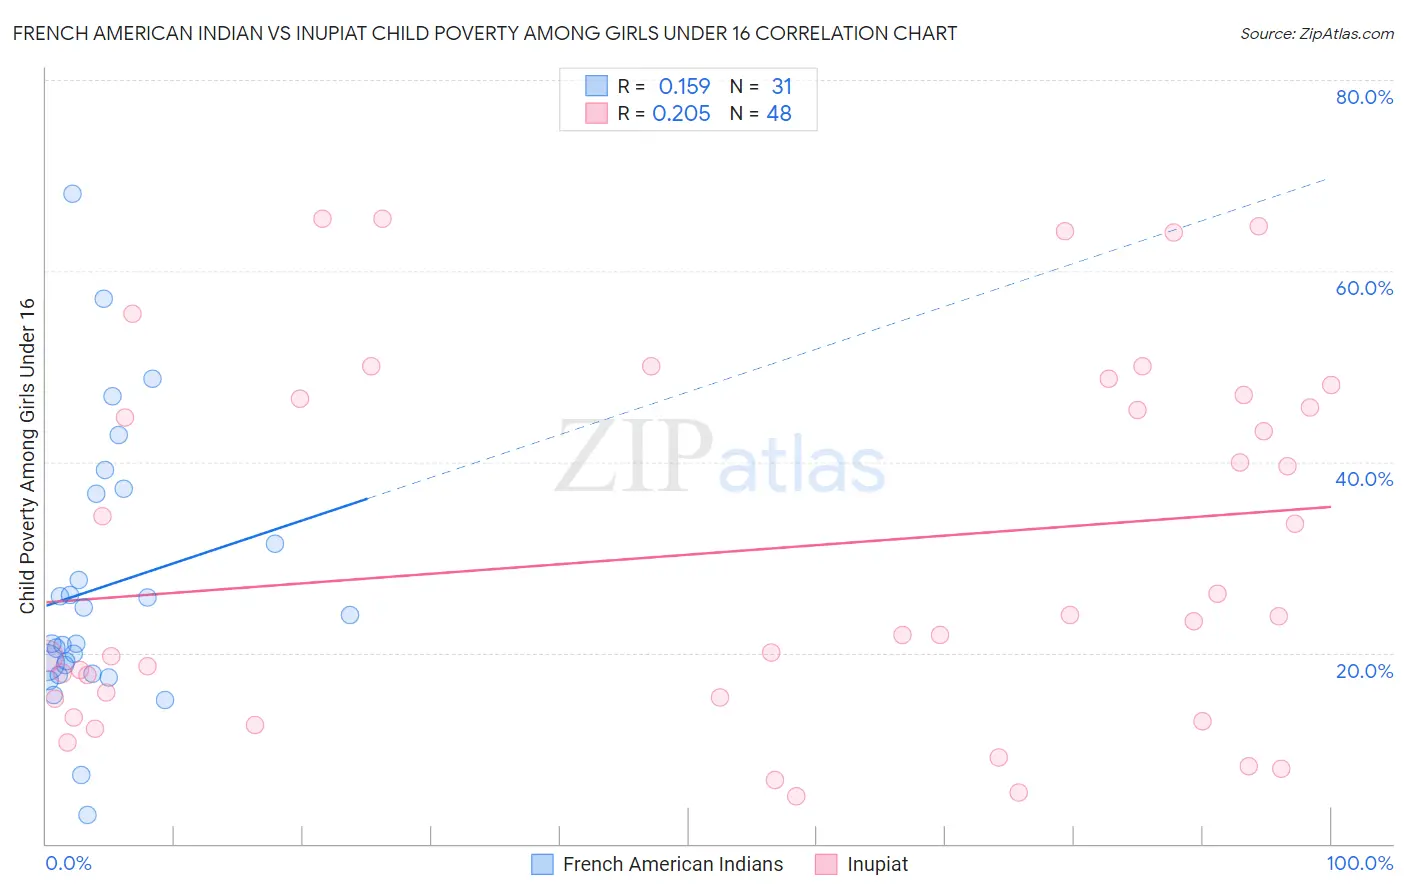
French American Indian vs Inupiat Child Poverty Among Girls Under 16 Correlation Chart
The statistical analysis conducted on geographies consisting of 131,073,161 people shows a poor positive correlation between the proportion of French American Indians and poverty level among girls under the age of 16 in the United States with a correlation coefficient (R) of 0.159 and weighted average of 19.2%. Similarly, the statistical analysis conducted on geographies consisting of 95,999,141 people shows a weak positive correlation between the proportion of Inupiat and poverty level among girls under the age of 16 in the United States with a correlation coefficient (R) of 0.205 and weighted average of 20.8%, a difference of 8.1%.
Child Poverty Among Girls Under 16 Correlation Summary
| Measurement | French American Indian | Inupiat |
| Minimum | 3.0% | 5.0% |
| Maximum | 68.1% | 65.5% |
| Range | 65.1% | 60.5% |
| Mean | 26.9% | 30.6% |
| Median | 21.0% | 23.6% |
| Interquartile 25% (IQ1) | 17.8% | 15.2% |
| Interquartile 75% (IQ3) | 36.7% | 46.8% |
| Interquartile Range (IQR) | 18.9% | 31.6% |
| Standard Deviation (Sample) | 14.3% | 18.9% |
| Standard Deviation (Population) | 14.0% | 18.7% |
Similar Demographics by Child Poverty Among Girls Under 16
Demographics Similar to French American Indians by Child Poverty Among Girls Under 16
In terms of child poverty among girls under 16, the demographic groups most similar to French American Indians are Potawatomi (19.2%, a difference of 0.020%), Cape Verdean (19.2%, a difference of 0.050%), Immigrants from Trinidad and Tobago (19.2%, a difference of 0.16%), Immigrants from Middle Africa (19.2%, a difference of 0.20%), and Immigrants from Guyana (19.3%, a difference of 0.39%).
| Demographics | Rating | Rank | Child Poverty Among Girls Under 16 |
| Americans | 0.8 /100 | #241 | Tragic 18.8% |
| Immigrants | Cuba | 0.7 /100 | #242 | Tragic 18.8% |
| Immigrants | Nicaragua | 0.7 /100 | #243 | Tragic 18.8% |
| Ecuadorians | 0.7 /100 | #244 | Tragic 18.8% |
| Shoshone | 0.6 /100 | #245 | Tragic 18.9% |
| Immigrants | Laos | 0.6 /100 | #246 | Tragic 18.9% |
| Immigrants | Ghana | 0.5 /100 | #247 | Tragic 18.9% |
| French American Indians | 0.3 /100 | #248 | Tragic 19.2% |
| Potawatomi | 0.3 /100 | #249 | Tragic 19.2% |
| Cape Verdeans | 0.3 /100 | #250 | Tragic 19.2% |
| Immigrants | Trinidad and Tobago | 0.3 /100 | #251 | Tragic 19.2% |
| Immigrants | Middle Africa | 0.3 /100 | #252 | Tragic 19.2% |
| Immigrants | Guyana | 0.3 /100 | #253 | Tragic 19.3% |
| Immigrants | Western Africa | 0.3 /100 | #254 | Tragic 19.3% |
| Immigrants | Ecuador | 0.3 /100 | #255 | Tragic 19.3% |
Demographics Similar to Inupiat by Child Poverty Among Girls Under 16
In terms of child poverty among girls under 16, the demographic groups most similar to Inupiat are Immigrants from West Indies (20.7%, a difference of 0.070%), Immigrants from Caribbean (20.7%, a difference of 0.34%), Immigrants from Senegal (20.7%, a difference of 0.38%), Immigrants from Grenada (20.7%, a difference of 0.49%), and Mexican (20.9%, a difference of 0.52%).
| Demographics | Rating | Rank | Child Poverty Among Girls Under 16 |
| Immigrants | Haiti | 0.0 /100 | #290 | Tragic 20.6% |
| Chippewa | 0.0 /100 | #291 | Tragic 20.6% |
| Immigrants | Latin America | 0.0 /100 | #292 | Tragic 20.6% |
| Immigrants | Grenada | 0.0 /100 | #293 | Tragic 20.7% |
| Immigrants | Senegal | 0.0 /100 | #294 | Tragic 20.7% |
| Immigrants | Caribbean | 0.0 /100 | #295 | Tragic 20.7% |
| Immigrants | West Indies | 0.0 /100 | #296 | Tragic 20.7% |
| Inupiat | 0.0 /100 | #297 | Tragic 20.8% |
| Mexicans | 0.0 /100 | #298 | Tragic 20.9% |
| Hispanics or Latinos | 0.0 /100 | #299 | Tragic 21.0% |
| Somalis | 0.0 /100 | #300 | Tragic 21.0% |
| Choctaw | 0.0 /100 | #301 | Tragic 21.1% |
| Seminole | 0.0 /100 | #302 | Tragic 21.2% |
| British West Indians | 0.0 /100 | #303 | Tragic 21.3% |
| Indonesians | 0.0 /100 | #304 | Tragic 21.3% |