European vs Haitian Child Poverty Among Girls Under 16

COMPARE

European
Race
Ancestry
AfghanAfricanAlaska NativeAlaskan AthabascanAlbanianAleutAlsatianAmericanApacheArabArapahoArgentineanArmenianAssyrian/Chaldean/SyriacAustralianAustrianBahamianBangladeshiBarbadianBasqueBelgianBelizeanBermudanBhutaneseBlackfeetBolivianBrazilianBritishBritish West IndianBulgarianBurmeseCajunCambodianCanadianCape VerdeanCarpatho RusynCelticCentral AmericanCentral American IndianCherokeeCheyenneChickasawChileanChineseChippewaChoctawColombianColvilleComancheCosta RicanCreeCreekCroatianCrowCubanCypriotCzechCzechoslovakianDanishDelawareDominicanDutchDutch West IndianEastern EuropeanEcuadorianEgyptianEnglishEstonianEthiopianEuropeanFijianFilipinoFinnishFrenchFrench American IndianFrench CanadianGermanGerman RussianGhanaianGreekGuamanian/ChamorroGuatemalanGuyaneseHmongHonduranHopiHoumaHungarianIcelanderIndian (Asian)IndonesianInupiatIranianIraqiIrishIroquoisIsraeliItalianJamaicanJapaneseJordanianKenyanKiowaKoreanLaotianLatvianLebaneseLiberianLithuanianLumbeeLuxembourgerMacedonianMalaysianMalteseMarshalleseMenomineeMexicanMexican American IndianMongolianMoroccanNative HawaiianNavajoNepaleseNew ZealanderNicaraguanNigerianNorthern EuropeanNorwegianOkinawanOsageOttawaPaiutePakistaniPalestinianPanamanianParaguayanPennsylvania GermanPeruvianPimaPolishPortuguesePotawatomiPuebloPuerto RicanPuget Sound SalishRomanianRussianSalvadoranSamoanScandinavianScotch-IrishScottishSeminoleSenegaleseSerbianShoshoneSierra LeoneanSiouxSlavicSlovakSloveneSomaliSouth AfricanSouth AmericanSouth American IndianSoviet UnionSpaniardSpanishSpanish AmericanSpanish American IndianSri LankanSubsaharan AfricanSudaneseSwedishSwissSyrianTaiwaneseThaiTlingit-HaidaTohono O'OdhamTonganTrinidadian and TobagonianTsimshianTurkishU.S. Virgin IslanderUgandanUkrainianUruguayanUteVenezuelanVietnameseWelshWest IndianYakamaYaquiYugoslavianYumanYup'ikZimbabwean
Immigration
NonimmigrantsImmigrantsAfghanistanAfricaAlbaniaArgentinaArmeniaAsiaAustraliaAustriaBahamasBangladeshBarbadosBelarusBelgiumBelizeBoliviaBosnia and HerzegovinaBrazilBulgariaBurma/MyanmarCabo VerdeCambodiaCameroonCanadaCaribbeanCentral AmericaChileChinaColombiaCongoCosta RicaCroatiaCubaCzechoslovakiaDenmarkDominicaDominican RepublicEastern AfricaEastern AsiaEastern EuropeEcuadorEgyptEl SalvadorEnglandEritreaEthiopiaEuropeFijiFranceGermanyGhanaGreeceGrenadaGuatemalaGuyanaHaitiHondurasHong KongHungaryIndiaIndonesiaIranIraqIrelandIsraelItalyJamaicaJapanJordanKazakhstanKenyaKoreaKuwaitLaosLatin AmericaLatviaLebanonLiberiaLithuaniaMalaysiaMexicoMicronesiaMiddle AfricaMoldovaMoroccoNepalNetherlandsNicaraguaNigeriaNorth AmericaNorth MacedoniaNorthern AfricaNorthern EuropeNorwayOceaniaPakistanPanamaPeruPhilippinesPolandPortugalRomaniaRussiaSaudi ArabiaScotlandSenegalSerbiaSierra LeoneSingaporeSomaliaSouth AfricaSouth AmericaSouth Central AsiaSouth Eastern AsiaSouthern EuropeSpainSri LankaSt. Vincent and the GrenadinesSudanSwedenSwitzerlandSyriaTaiwanThailandTrinidad and TobagoTurkeyUgandaUkraineUruguayUzbekistanVenezuelaVietnamWest IndiesWestern AfricaWestern AsiaWestern EuropeYemenZaireZimbabweAzores
Haitian
Race
Ancestry
AfghanAfricanAlaska NativeAlaskan AthabascanAlbanianAleutAlsatianAmericanApacheArabArapahoArgentineanArmenianAssyrian/Chaldean/SyriacAustralianAustrianBahamianBangladeshiBarbadianBasqueBelgianBelizeanBermudanBhutaneseBlackfeetBolivianBrazilianBritishBritish West IndianBulgarianBurmeseCajunCambodianCanadianCape VerdeanCarpatho RusynCelticCentral AmericanCentral American IndianCherokeeCheyenneChickasawChileanChineseChippewaChoctawColombianColvilleComancheCosta RicanCreeCreekCroatianCrowCubanCypriotCzechCzechoslovakianDanishDelawareDominicanDutchDutch West IndianEastern EuropeanEcuadorianEgyptianEnglishEstonianEthiopianFijianFilipinoFinnishFrenchFrench American IndianFrench CanadianGermanGerman RussianGhanaianGreekGuamanian/ChamorroGuatemalanGuyaneseHaitianHmongHonduranHopiHoumaHungarianIcelanderIndian (Asian)IndonesianInupiatIranianIraqiIrishIroquoisIsraeliItalianJamaicanJapaneseJordanianKenyanKiowaKoreanLaotianLatvianLebaneseLiberianLithuanianLumbeeLuxembourgerMacedonianMalaysianMalteseMarshalleseMenomineeMexicanMexican American IndianMongolianMoroccanNative HawaiianNavajoNepaleseNew ZealanderNicaraguanNigerianNorthern EuropeanNorwegianOkinawanOsageOttawaPaiutePakistaniPalestinianPanamanianParaguayanPennsylvania GermanPeruvianPimaPolishPortuguesePotawatomiPuebloPuerto RicanPuget Sound SalishRomanianRussianSalvadoranSamoanScandinavianScotch-IrishScottishSeminoleSenegaleseSerbianShoshoneSierra LeoneanSiouxSlavicSlovakSloveneSomaliSouth AfricanSouth AmericanSouth American IndianSoviet UnionSpaniardSpanishSpanish AmericanSpanish American IndianSri LankanSubsaharan AfricanSudaneseSwedishSwissSyrianTaiwaneseThaiTlingit-HaidaTohono O'OdhamTonganTrinidadian and TobagonianTsimshianTurkishU.S. Virgin IslanderUgandanUkrainianUruguayanUteVenezuelanVietnameseWelshWest IndianYakamaYaquiYugoslavianYumanYup'ikZimbabwean
Immigration
NonimmigrantsImmigrantsAfghanistanAfricaAlbaniaArgentinaArmeniaAsiaAustraliaAustriaBahamasBangladeshBarbadosBelarusBelgiumBelizeBoliviaBosnia and HerzegovinaBrazilBulgariaBurma/MyanmarCabo VerdeCambodiaCameroonCanadaCaribbeanCentral AmericaChileChinaColombiaCongoCosta RicaCroatiaCubaCzechoslovakiaDenmarkDominicaDominican RepublicEastern AfricaEastern AsiaEastern EuropeEcuadorEgyptEl SalvadorEnglandEritreaEthiopiaEuropeFijiFranceGermanyGhanaGreeceGrenadaGuatemalaGuyanaHaitiHondurasHong KongHungaryIndiaIndonesiaIranIraqIrelandIsraelItalyJamaicaJapanJordanKazakhstanKenyaKoreaKuwaitLaosLatin AmericaLatviaLebanonLiberiaLithuaniaMalaysiaMexicoMicronesiaMiddle AfricaMoldovaMoroccoNepalNetherlandsNicaraguaNigeriaNorth AmericaNorth MacedoniaNorthern AfricaNorthern EuropeNorwayOceaniaPakistanPanamaPeruPhilippinesPolandPortugalRomaniaRussiaSaudi ArabiaScotlandSenegalSerbiaSierra LeoneSingaporeSomaliaSouth AfricaSouth AmericaSouth Central AsiaSouth Eastern AsiaSouthern EuropeSpainSri LankaSt. Vincent and the GrenadinesSudanSwedenSwitzerlandSyriaTaiwanThailandTrinidad and TobagoTurkeyUgandaUkraineUruguayUzbekistanVenezuelaVietnamWest IndiesWestern AfricaWestern AsiaWestern EuropeYemenZaireZimbabweAzores
Child Poverty Among Girls Under 16
Income
Poverty
Unemployment
Labor Participation
Family Structure
Vehicle Availability
Education Level
Disability

Child Poverty Among Girls Under 16 Comparison

Europeans

Haitians

Exceptional
Tragic
14.6%
CHILD POVERTY AMONG GIRLS UNDER 16
98.1/ 100
METRIC RATING
70th/ 347
METRIC RANK
20.5%
CHILD POVERTY AMONG GIRLS UNDER 16
0.0/ 100
METRIC RATING
288th/ 347
METRIC RANK

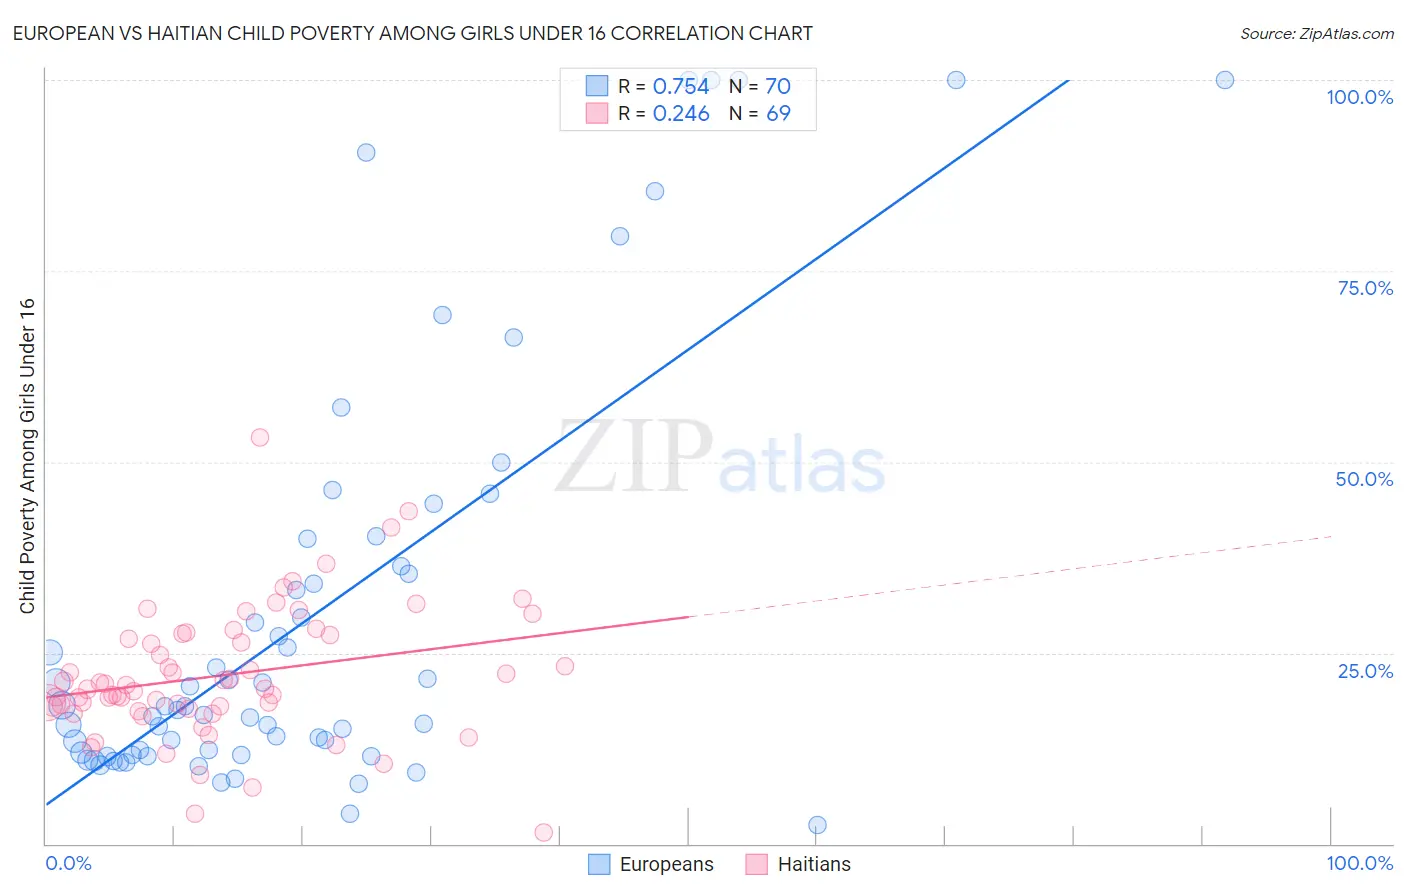
European vs Haitian Child Poverty Among Girls Under 16 Correlation Chart

The statistical analysis conducted on geographies consisting of 541,040,111 people shows a strong positive correlation between the proportion of Europeans and poverty level among girls under the age of 16 in the United States with a correlation coefficient (R) of 0.754 and weighted average of 14.6%. Similarly, the statistical analysis conducted on geographies consisting of 284,231,337 people shows a weak positive correlation between the proportion of Haitians and poverty level among girls under the age of 16 in the United States with a correlation coefficient (R) of 0.246 and weighted average of 20.5%, a difference of 40.5%.
European vs Haitian Child Poverty Among Girls Under 16

Child Poverty Among Girls Under 16 Correlation Summary

MeasurementEuropeanHaitian
Minimum2.4%1.5%
Maximum100.0%53.2%
Range97.6%51.7%
Mean29.9%22.0%
Median17.7%20.2%
Interquartile 25% (IQ1)11.7%17.8%
Interquartile 75% (IQ3)36.4%27.4%
Interquartile Range (IQR)24.7%9.6%
Standard Deviation (Sample)27.3%8.7%
Standard Deviation (Population)27.1%8.7%

Similar Demographics by Child Poverty Among Girls Under 16

Demographics Similar to Europeans by Child Poverty Among Girls Under 16

In terms of child poverty among girls under 16, the demographic groups most similar to Europeans are Slovene (14.6%, a difference of 0.040%), Immigrants from Netherlands (14.6%, a difference of 0.060%), Immigrants from Poland (14.6%, a difference of 0.12%), Immigrants from Austria (14.6%, a difference of 0.16%), and Taiwanese (14.6%, a difference of 0.19%).
DemographicsRating | RankChild Poverty Among Girls Under 16
Immigrants | Europe
98.7
/100
|
#63
Exceptional
14.4%
Immigrants | Philippines
98.6
/100
|
#64
Exceptional
14.4%
Immigrants | Sweden
98.6
/100
|
#65
Exceptional
14.5%
Immigrants | Belgium
98.5
/100
|
#66
Exceptional
14.5%
Laotians
98.4
/100
|
#67
Exceptional
14.5%
Immigrants | Argentina
98.3
/100
|
#68
Exceptional
14.6%
Immigrants | Poland
98.2
/100
|
#69
Exceptional
14.6%
Europeans
98.1
/100
|
#70
Exceptional
14.6%
Slovenes
98.1
/100
|
#71
Exceptional
14.6%
Immigrants | Netherlands
98.1
/100
|
#72
Exceptional
14.6%
Immigrants | Austria
98.0
/100
|
#73
Exceptional
14.6%
Taiwanese
98.0
/100
|
#74
Exceptional
14.6%
Immigrants | Eastern Europe
98.0
/100
|
#75
Exceptional
14.6%
Immigrants | Russia
97.9
/100
|
#76
Exceptional
14.7%
Tlingit-Haida
97.9
/100
|
#77
Exceptional
14.7%

Demographics Similar to Haitians by Child Poverty Among Girls Under 16

In terms of child poverty among girls under 16, the demographic groups most similar to Haitians are Blackfeet (20.5%, a difference of 0.20%), Iroquois (20.4%, a difference of 0.34%), Immigrants from Belize (20.6%, a difference of 0.46%), Immigrants from Haiti (20.6%, a difference of 0.53%), and Chippewa (20.6%, a difference of 0.67%).
DemographicsRating | RankChild Poverty Among Girls Under 16
Central Americans
0.0
/100
|
#281
Tragic
20.2%
West Indians
0.0
/100
|
#282
Tragic
20.3%
Senegalese
0.0
/100
|
#283
Tragic
20.3%
Yaqui
0.0
/100
|
#284
Tragic
20.3%
Immigrants | Cabo Verde
0.0
/100
|
#285
Tragic
20.3%
Iroquois
0.0
/100
|
#286
Tragic
20.4%
Blackfeet
0.0
/100
|
#287
Tragic
20.5%
Haitians
0.0
/100
|
#288
Tragic
20.5%
Immigrants | Belize
0.0
/100
|
#289
Tragic
20.6%
Immigrants | Haiti
0.0
/100
|
#290
Tragic
20.6%
Chippewa
0.0
/100
|
#291
Tragic
20.6%
Immigrants | Latin America
0.0
/100
|
#292
Tragic
20.6%
Immigrants | Grenada
0.0
/100
|
#293
Tragic
20.7%
Immigrants | Senegal
0.0
/100
|
#294
Tragic
20.7%
Immigrants | Caribbean
0.0
/100
|
#295
Tragic
20.7%