Ethiopian vs Uruguayan Child Poverty Among Girls Under 16

COMPARE

Ethiopian
Race
Ancestry
AfghanAfricanAlaska NativeAlaskan AthabascanAlbanianAleutAlsatianAmericanApacheArabArapahoArgentineanArmenianAssyrian/Chaldean/SyriacAustralianAustrianBahamianBangladeshiBarbadianBasqueBelgianBelizeanBermudanBhutaneseBlackfeetBolivianBrazilianBritishBritish West IndianBulgarianBurmeseCajunCambodianCanadianCape VerdeanCarpatho RusynCelticCentral AmericanCentral American IndianCherokeeCheyenneChickasawChileanChineseChippewaChoctawColombianColvilleComancheCosta RicanCreeCreekCroatianCrowCubanCypriotCzechCzechoslovakianDanishDelawareDominicanDutchDutch West IndianEastern EuropeanEcuadorianEgyptianEnglishEstonianEthiopianEuropeanFijianFilipinoFinnishFrenchFrench American IndianFrench CanadianGermanGerman RussianGhanaianGreekGuamanian/ChamorroGuatemalanGuyaneseHaitianHmongHonduranHopiHoumaHungarianIcelanderIndian (Asian)IndonesianInupiatIranianIraqiIrishIroquoisIsraeliItalianJamaicanJapaneseJordanianKenyanKiowaKoreanLaotianLatvianLebaneseLiberianLithuanianLumbeeLuxembourgerMacedonianMalaysianMalteseMarshalleseMenomineeMexicanMexican American IndianMongolianMoroccanNative HawaiianNavajoNepaleseNew ZealanderNicaraguanNigerianNorthern EuropeanNorwegianOkinawanOsageOttawaPaiutePakistaniPalestinianPanamanianParaguayanPennsylvania GermanPeruvianPimaPolishPortuguesePotawatomiPuebloPuerto RicanPuget Sound SalishRomanianRussianSalvadoranSamoanScandinavianScotch-IrishScottishSeminoleSenegaleseSerbianShoshoneSierra LeoneanSiouxSlavicSlovakSloveneSomaliSouth AfricanSouth AmericanSouth American IndianSoviet UnionSpaniardSpanishSpanish AmericanSpanish American IndianSri LankanSubsaharan AfricanSudaneseSwedishSwissSyrianTaiwaneseThaiTlingit-HaidaTohono O'OdhamTonganTrinidadian and TobagonianTsimshianTurkishU.S. Virgin IslanderUgandanUkrainianUteVenezuelanVietnameseWelshWest IndianYakamaYaquiYugoslavianYumanYup'ikZimbabwean
Immigration
NonimmigrantsImmigrantsAfghanistanAfricaAlbaniaArgentinaArmeniaAsiaAustraliaAustriaBahamasBangladeshBarbadosBelarusBelgiumBelizeBoliviaBosnia and HerzegovinaBrazilBulgariaBurma/MyanmarCabo VerdeCambodiaCameroonCanadaCaribbeanCentral AmericaChileChinaColombiaCongoCosta RicaCroatiaCubaCzechoslovakiaDenmarkDominicaDominican RepublicEastern AfricaEastern AsiaEastern EuropeEcuadorEgyptEl SalvadorEnglandEritreaEthiopiaEuropeFijiFranceGermanyGhanaGreeceGrenadaGuatemalaGuyanaHaitiHondurasHong KongHungaryIndiaIndonesiaIranIraqIrelandIsraelItalyJamaicaJapanJordanKazakhstanKenyaKoreaKuwaitLaosLatin AmericaLatviaLebanonLiberiaLithuaniaMalaysiaMexicoMicronesiaMiddle AfricaMoldovaMoroccoNepalNetherlandsNicaraguaNigeriaNorth AmericaNorth MacedoniaNorthern AfricaNorthern EuropeNorwayOceaniaPakistanPanamaPeruPhilippinesPolandPortugalRomaniaRussiaSaudi ArabiaScotlandSenegalSerbiaSierra LeoneSingaporeSomaliaSouth AfricaSouth AmericaSouth Central AsiaSouth Eastern AsiaSouthern EuropeSpainSri LankaSt. Vincent and the GrenadinesSudanSwedenSwitzerlandSyriaTaiwanThailandTrinidad and TobagoTurkeyUgandaUkraineUruguayUzbekistanVenezuelaVietnamWest IndiesWestern AfricaWestern AsiaWestern EuropeYemenZaireZimbabweAzores
Uruguayan
Race
Ancestry
AfghanAfricanAlaska NativeAlaskan AthabascanAlbanianAleutAlsatianAmericanApacheArabArapahoArgentineanArmenianAssyrian/Chaldean/SyriacAustralianAustrianBahamianBangladeshiBarbadianBasqueBelgianBelizeanBermudanBhutaneseBlackfeetBolivianBrazilianBritishBritish West IndianBulgarianBurmeseCajunCambodianCanadianCape VerdeanCarpatho RusynCelticCentral AmericanCentral American IndianCherokeeCheyenneChickasawChileanChineseChippewaChoctawColombianColvilleComancheCosta RicanCreeCreekCroatianCrowCubanCypriotCzechCzechoslovakianDanishDelawareDominicanDutchDutch West IndianEastern EuropeanEcuadorianEgyptianEnglishEstonianEuropeanFijianFilipinoFinnishFrenchFrench American IndianFrench CanadianGermanGerman RussianGhanaianGreekGuamanian/ChamorroGuatemalanGuyaneseHaitianHmongHonduranHopiHoumaHungarianIcelanderIndian (Asian)IndonesianInupiatIranianIraqiIrishIroquoisIsraeliItalianJamaicanJapaneseJordanianKenyanKiowaKoreanLaotianLatvianLebaneseLiberianLithuanianLumbeeLuxembourgerMacedonianMalaysianMalteseMarshalleseMenomineeMexicanMexican American IndianMongolianMoroccanNative HawaiianNavajoNepaleseNew ZealanderNicaraguanNigerianNorthern EuropeanNorwegianOkinawanOsageOttawaPaiutePakistaniPalestinianPanamanianParaguayanPennsylvania GermanPeruvianPimaPolishPortuguesePotawatomiPuebloPuerto RicanPuget Sound SalishRomanianRussianSalvadoranSamoanScandinavianScotch-IrishScottishSeminoleSenegaleseSerbianShoshoneSierra LeoneanSiouxSlavicSlovakSloveneSomaliSouth AfricanSouth AmericanSouth American IndianSoviet UnionSpaniardSpanishSpanish AmericanSpanish American IndianSri LankanSubsaharan AfricanSudaneseSwedishSwissSyrianTaiwaneseThaiTlingit-HaidaTohono O'OdhamTonganTrinidadian and TobagonianTsimshianTurkishU.S. Virgin IslanderUgandanUkrainianUruguayanUteVenezuelanVietnameseWelshWest IndianYakamaYaquiYugoslavianYumanYup'ikZimbabwean
Immigration
NonimmigrantsImmigrantsAfghanistanAfricaAlbaniaArgentinaArmeniaAsiaAustraliaAustriaBahamasBangladeshBarbadosBelarusBelgiumBelizeBoliviaBosnia and HerzegovinaBrazilBulgariaBurma/MyanmarCabo VerdeCambodiaCameroonCanadaCaribbeanCentral AmericaChileChinaColombiaCongoCosta RicaCroatiaCubaCzechoslovakiaDenmarkDominicaDominican RepublicEastern AfricaEastern AsiaEastern EuropeEcuadorEgyptEl SalvadorEnglandEritreaEthiopiaEuropeFijiFranceGermanyGhanaGreeceGrenadaGuatemalaGuyanaHaitiHondurasHong KongHungaryIndiaIndonesiaIranIraqIrelandIsraelItalyJamaicaJapanJordanKazakhstanKenyaKoreaKuwaitLaosLatin AmericaLatviaLebanonLiberiaLithuaniaMalaysiaMexicoMicronesiaMiddle AfricaMoldovaMoroccoNepalNetherlandsNicaraguaNigeriaNorth AmericaNorth MacedoniaNorthern AfricaNorthern EuropeNorwayOceaniaPakistanPanamaPeruPhilippinesPolandPortugalRomaniaRussiaSaudi ArabiaScotlandSenegalSerbiaSierra LeoneSingaporeSomaliaSouth AfricaSouth AmericaSouth Central AsiaSouth Eastern AsiaSouthern EuropeSpainSri LankaSt. Vincent and the GrenadinesSudanSwedenSwitzerlandSyriaTaiwanThailandTrinidad and TobagoTurkeyUgandaUkraineUruguayUzbekistanVenezuelaVietnamWest IndiesWestern AfricaWestern AsiaWestern EuropeYemenZaireZimbabweAzores
Child Poverty Among Girls Under 16
Income
Poverty
Unemployment
Labor Participation
Family Structure
Vehicle Availability
Education Level
Disability

Child Poverty Among Girls Under 16 Comparison

Ethiopians

Uruguayans

Average
Good
16.5%
CHILD POVERTY AMONG GIRLS UNDER 16
50.0/ 100
METRIC RATING
174th/ 347
METRIC RANK
16.2%
CHILD POVERTY AMONG GIRLS UNDER 16
64.7/ 100
METRIC RATING
167th/ 347
METRIC RANK

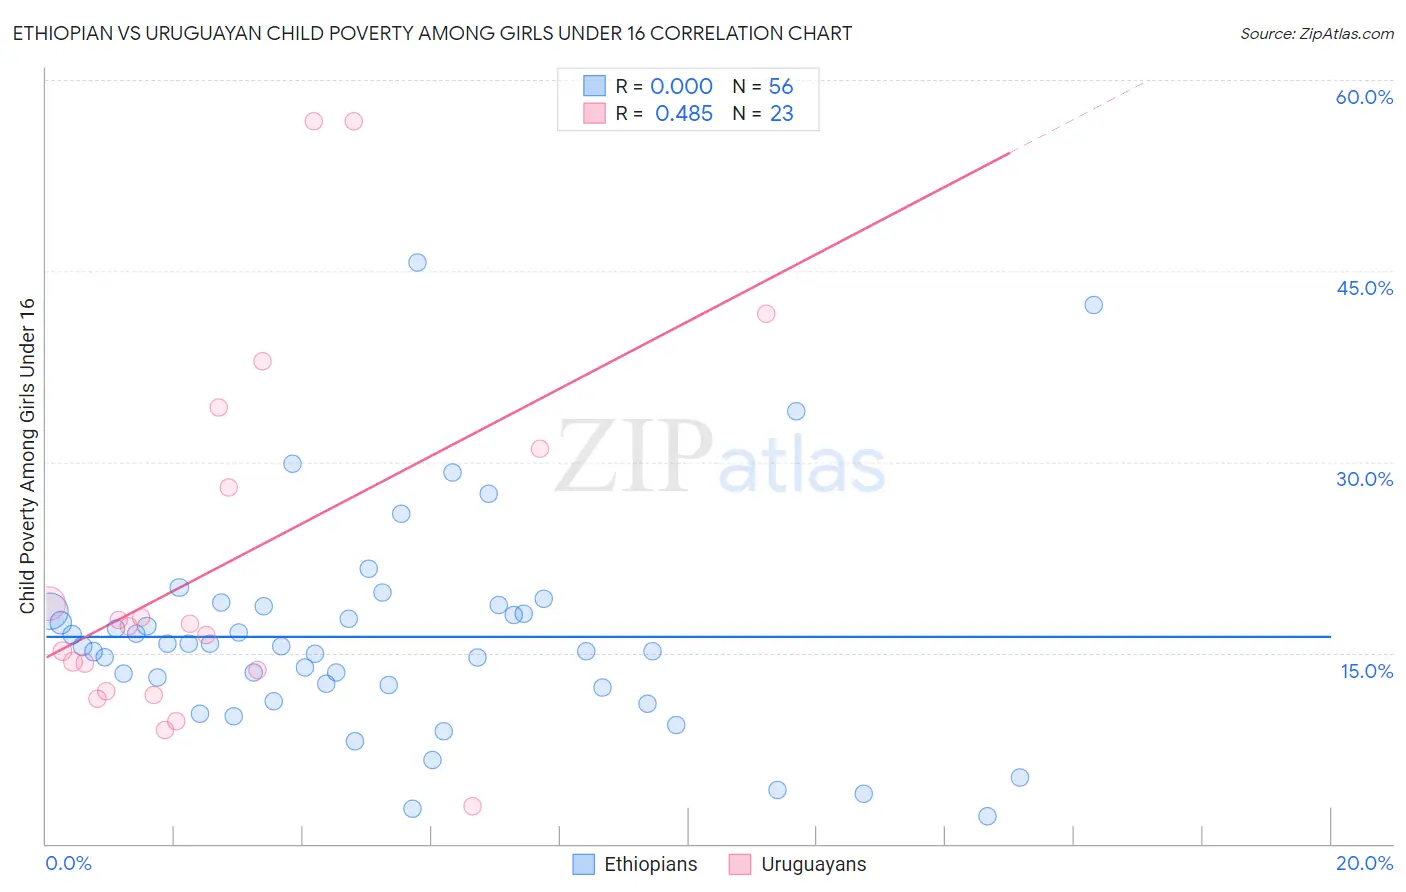
Ethiopian vs Uruguayan Child Poverty Among Girls Under 16 Correlation Chart

The statistical analysis conducted on geographies consisting of 221,230,982 people shows no correlation between the proportion of Ethiopians and poverty level among girls under the age of 16 in the United States with a correlation coefficient (R) of 0.000 and weighted average of 16.5%. Similarly, the statistical analysis conducted on geographies consisting of 143,695,709 people shows a moderate positive correlation between the proportion of Uruguayans and poverty level among girls under the age of 16 in the United States with a correlation coefficient (R) of 0.485 and weighted average of 16.2%, a difference of 1.8%.
Ethiopian vs Uruguayan Child Poverty Among Girls Under 16

Child Poverty Among Girls Under 16 Correlation Summary

MeasurementEthiopianUruguayan
Minimum2.1%3.0%
Maximum45.6%56.8%
Range43.5%53.8%
Mean16.3%22.0%
Median15.5%17.1%
Interquartile 25% (IQ1)12.3%11.9%
Interquartile 75% (IQ3)18.5%31.0%
Interquartile Range (IQR)6.1%19.1%
Standard Deviation (Sample)8.3%14.6%
Standard Deviation (Population)8.3%14.3%

Demographics Similar to Ethiopians and Uruguayans by Child Poverty Among Girls Under 16

In terms of child poverty among girls under 16, the demographic groups most similar to Ethiopians are Lebanese (16.6%, a difference of 0.53%), Hungarian (16.6%, a difference of 0.56%), Immigrants from South America (16.4%, a difference of 0.59%), Immigrants from Western Asia (16.6%, a difference of 0.68%), and White/Caucasian (16.6%, a difference of 0.73%). Similarly, the demographic groups most similar to Uruguayans are Yugoslavian (16.2%, a difference of 0.040%), Costa Rican (16.2%, a difference of 0.060%), Immigrants from Venezuela (16.2%, a difference of 0.060%), Immigrants from Saudi Arabia (16.2%, a difference of 0.090%), and Afghan (16.2%, a difference of 0.30%).
DemographicsRating | RankChild Poverty Among Girls Under 16
French
72.8
/100
|
#160
Good
16.0%
Immigrants | Northern Africa
72.0
/100
|
#161
Good
16.0%
French Canadians
68.7
/100
|
#162
Good
16.1%
Immigrants | Oceania
68.4
/100
|
#163
Good
16.1%
Immigrants | Colombia
67.8
/100
|
#164
Good
16.1%
Immigrants | Germany
67.3
/100
|
#165
Good
16.1%
South Americans
67.2
/100
|
#166
Good
16.1%
Uruguayans
64.7
/100
|
#167
Good
16.2%
Yugoslavians
64.4
/100
|
#168
Good
16.2%
Costa Ricans
64.2
/100
|
#169
Good
16.2%
Immigrants | Venezuela
64.2
/100
|
#170
Good
16.2%
Immigrants | Saudi Arabia
64.0
/100
|
#171
Good
16.2%
Afghans
62.3
/100
|
#172
Good
16.2%
Immigrants | South America
55.1
/100
|
#173
Average
16.4%
Ethiopians
50.0
/100
|
#174
Average
16.5%
Lebanese
45.4
/100
|
#175
Average
16.6%
Hungarians
45.1
/100
|
#176
Average
16.6%
Immigrants | Western Asia
44.1
/100
|
#177
Average
16.6%
Whites/Caucasians
43.6
/100
|
#178
Average
16.6%
Hawaiians
43.4
/100
|
#179
Average
16.6%
Immigrants | Syria
43.3
/100
|
#180
Average
16.6%