Ethiopian vs Scandinavian Single Female Poverty
COMPARE
Ethiopian
Scandinavian
Single Female Poverty
Single Female Poverty Comparison
Ethiopians
Scandinavians
19.9%
SINGLE FEMALE POVERTY
96.7/ 100
METRIC RATING
106th/ 347
METRIC RANK
21.1%
SINGLE FEMALE POVERTY
45.2/ 100
METRIC RATING
177th/ 347
METRIC RANK
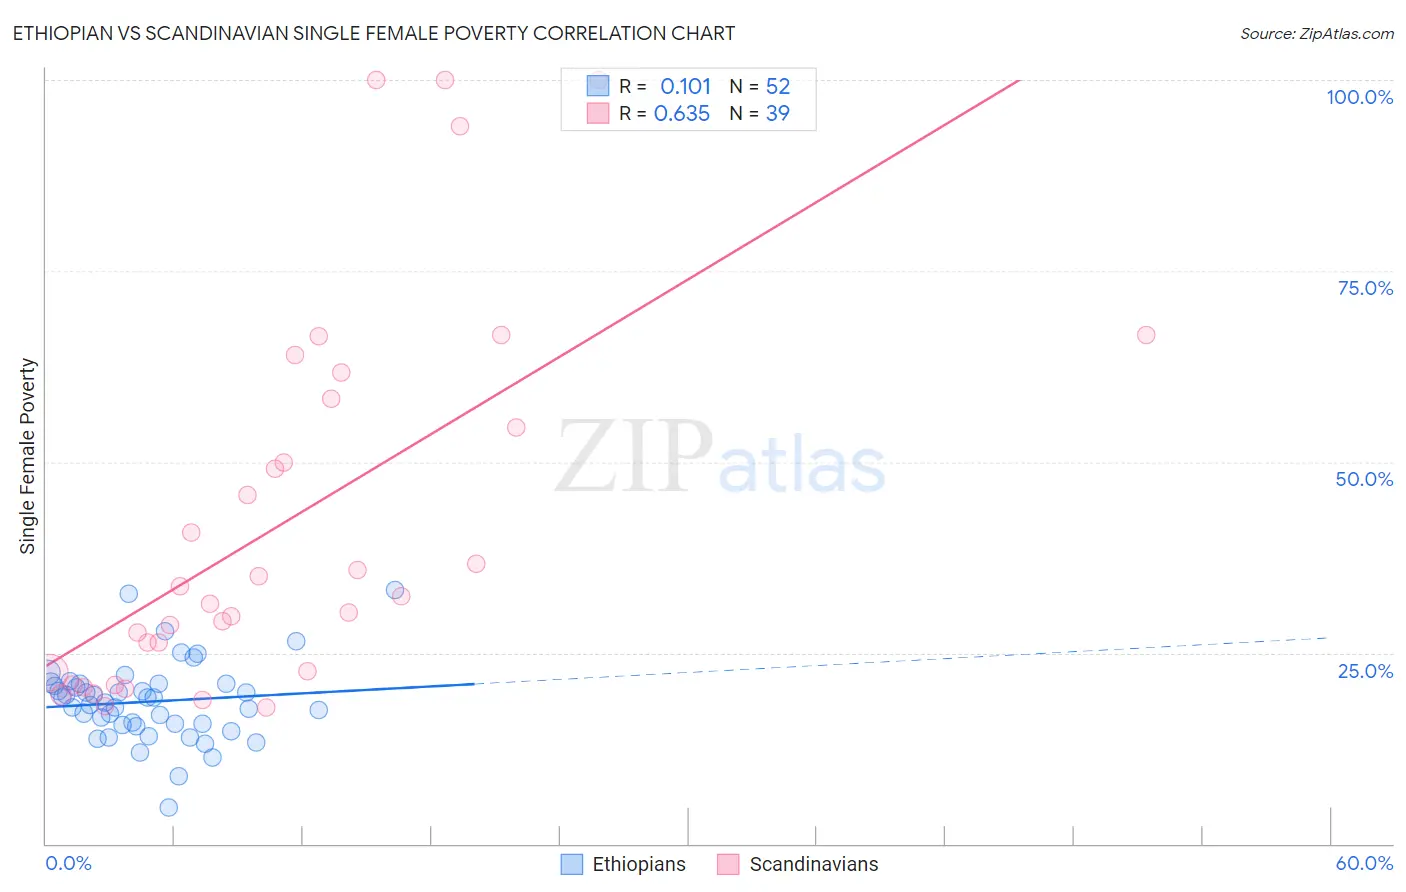
Ethiopian vs Scandinavian Single Female Poverty Correlation Chart
The statistical analysis conducted on geographies consisting of 221,686,273 people shows a poor positive correlation between the proportion of Ethiopians and poverty level among single females in the United States with a correlation coefficient (R) of 0.101 and weighted average of 19.9%. Similarly, the statistical analysis conducted on geographies consisting of 461,288,786 people shows a significant positive correlation between the proportion of Scandinavians and poverty level among single females in the United States with a correlation coefficient (R) of 0.635 and weighted average of 21.1%, a difference of 5.9%.
Single Female Poverty Correlation Summary
| Measurement | Ethiopian | Scandinavian |
| Minimum | 4.8% | 17.8% |
| Maximum | 33.2% | 100.0% |
| Range | 28.4% | 82.2% |
| Mean | 18.6% | 42.1% |
| Median | 18.8% | 32.4% |
| Interquartile 25% (IQ1) | 15.6% | 22.3% |
| Interquartile 75% (IQ3) | 20.9% | 58.3% |
| Interquartile Range (IQR) | 5.3% | 36.0% |
| Standard Deviation (Sample) | 5.2% | 24.6% |
| Standard Deviation (Population) | 5.1% | 24.3% |
Similar Demographics by Single Female Poverty
Demographics Similar to Ethiopians by Single Female Poverty
In terms of single female poverty, the demographic groups most similar to Ethiopians are Immigrants from Syria (19.9%, a difference of 0.020%), Native Hawaiian (19.9%, a difference of 0.070%), Colombian (19.9%, a difference of 0.070%), Immigrants from Western Asia (19.9%, a difference of 0.080%), and Israeli (19.9%, a difference of 0.090%).
| Demographics | Rating | Rank | Single Female Poverty |
| Sierra Leoneans | 97.9 /100 | #99 | Exceptional 19.7% |
| Ukrainians | 97.6 /100 | #100 | Exceptional 19.8% |
| Immigrants | Belgium | 97.3 /100 | #101 | Exceptional 19.8% |
| Immigrants | Cameroon | 97.3 /100 | #102 | Exceptional 19.8% |
| Immigrants | Southern Europe | 97.1 /100 | #103 | Exceptional 19.9% |
| Chileans | 96.9 /100 | #104 | Exceptional 19.9% |
| Israelis | 96.9 /100 | #105 | Exceptional 19.9% |
| Ethiopians | 96.7 /100 | #106 | Exceptional 19.9% |
| Immigrants | Syria | 96.7 /100 | #107 | Exceptional 19.9% |
| Native Hawaiians | 96.6 /100 | #108 | Exceptional 19.9% |
| Colombians | 96.6 /100 | #109 | Exceptional 19.9% |
| Immigrants | Western Asia | 96.5 /100 | #110 | Exceptional 19.9% |
| Carpatho Rusyns | 96.1 /100 | #111 | Exceptional 20.0% |
| Immigrants | Netherlands | 96.0 /100 | #112 | Exceptional 20.0% |
| Immigrants | Zimbabwe | 95.9 /100 | #113 | Exceptional 20.0% |
Demographics Similar to Scandinavians by Single Female Poverty
In terms of single female poverty, the demographic groups most similar to Scandinavians are Canadian (21.1%, a difference of 0.010%), Immigrants from Bosnia and Herzegovina (21.1%, a difference of 0.020%), Czech (21.0%, a difference of 0.10%), British (21.1%, a difference of 0.14%), and Spanish American Indian (21.1%, a difference of 0.17%).
| Demographics | Rating | Rank | Single Female Poverty |
| New Zealanders | 53.2 /100 | #170 | Average 21.0% |
| Moroccans | 52.8 /100 | #171 | Average 21.0% |
| Guyanese | 52.0 /100 | #172 | Average 21.0% |
| Immigrants | Guyana | 50.6 /100 | #173 | Average 21.0% |
| Cubans | 50.0 /100 | #174 | Average 21.0% |
| Czechs | 46.8 /100 | #175 | Average 21.0% |
| Canadians | 45.4 /100 | #176 | Average 21.1% |
| Scandinavians | 45.2 /100 | #177 | Average 21.1% |
| Immigrants | Bosnia and Herzegovina | 44.9 /100 | #178 | Average 21.1% |
| British | 42.9 /100 | #179 | Average 21.1% |
| Spanish American Indians | 42.5 /100 | #180 | Average 21.1% |
| Europeans | 42.3 /100 | #181 | Average 21.1% |
| Slavs | 40.5 /100 | #182 | Average 21.1% |
| Slovaks | 39.7 /100 | #183 | Fair 21.1% |
| Hungarians | 39.6 /100 | #184 | Fair 21.1% |