Estonian vs Immigrants from Denmark Female Poverty

COMPARE

Estonian
Race
Ancestry
AfghanAfricanAlaska NativeAlaskan AthabascanAlbanianAleutAlsatianAmericanApacheArabArapahoArgentineanArmenianAssyrian/Chaldean/SyriacAustralianAustrianBahamianBangladeshiBarbadianBasqueBelgianBelizeanBermudanBhutaneseBlackfeetBolivianBrazilianBritishBritish West IndianBulgarianBurmeseCajunCambodianCanadianCape VerdeanCarpatho RusynCelticCentral AmericanCentral American IndianCherokeeCheyenneChickasawChileanChineseChippewaChoctawColombianColvilleComancheCosta RicanCreeCreekCroatianCrowCubanCypriotCzechCzechoslovakianDanishDelawareDominicanDutchDutch West IndianEastern EuropeanEcuadorianEgyptianEnglishEstonianEthiopianEuropeanFijianFilipinoFinnishFrenchFrench American IndianFrench CanadianGermanGerman RussianGhanaianGreekGuamanian/ChamorroGuatemalanGuyaneseHaitianHmongHonduranHopiHoumaHungarianIcelanderIndian (Asian)IndonesianInupiatIranianIraqiIrishIroquoisIsraeliItalianJamaicanJapaneseJordanianKenyanKiowaKoreanLaotianLatvianLebaneseLiberianLithuanianLumbeeLuxembourgerMacedonianMalaysianMalteseMarshalleseMenomineeMexicanMexican American IndianMongolianMoroccanNative HawaiianNavajoNepaleseNew ZealanderNicaraguanNigerianNorthern EuropeanNorwegianOkinawanOsageOttawaPaiutePakistaniPalestinianPanamanianParaguayanPennsylvania GermanPeruvianPimaPolishPortuguesePotawatomiPuebloPuerto RicanPuget Sound SalishRomanianRussianSalvadoranSamoanScandinavianScotch-IrishScottishSeminoleSenegaleseSerbianShoshoneSierra LeoneanSiouxSlavicSlovakSloveneSomaliSouth AfricanSouth AmericanSouth American IndianSoviet UnionSpaniardSpanishSpanish AmericanSpanish American IndianSri LankanSubsaharan AfricanSudaneseSwedishSwissSyrianTaiwaneseThaiTlingit-HaidaTohono O'OdhamTonganTrinidadian and TobagonianTsimshianTurkishU.S. Virgin IslanderUgandanUkrainianUruguayanUteVenezuelanVietnameseWelshWest IndianYakamaYaquiYugoslavianYumanYup'ikZimbabwean
Immigration
NonimmigrantsImmigrantsAfghanistanAfricaAlbaniaArgentinaArmeniaAsiaAustraliaAustriaBahamasBangladeshBarbadosBelarusBelgiumBelizeBoliviaBosnia and HerzegovinaBrazilBulgariaBurma/MyanmarCabo VerdeCambodiaCameroonCanadaCaribbeanCentral AmericaChileChinaColombiaCongoCosta RicaCroatiaCubaCzechoslovakiaDominicaDominican RepublicEastern AfricaEastern AsiaEastern EuropeEcuadorEgyptEl SalvadorEnglandEritreaEthiopiaEuropeFijiFranceGermanyGhanaGreeceGrenadaGuatemalaGuyanaHaitiHondurasHong KongHungaryIndiaIndonesiaIranIraqIrelandIsraelItalyJamaicaJapanJordanKazakhstanKenyaKoreaKuwaitLaosLatin AmericaLatviaLebanonLiberiaLithuaniaMalaysiaMexicoMicronesiaMiddle AfricaMoldovaMoroccoNepalNetherlandsNicaraguaNigeriaNorth AmericaNorth MacedoniaNorthern AfricaNorthern EuropeNorwayOceaniaPakistanPanamaPeruPhilippinesPolandPortugalRomaniaRussiaSaudi ArabiaScotlandSenegalSerbiaSierra LeoneSingaporeSomaliaSouth AfricaSouth AmericaSouth Central AsiaSouth Eastern AsiaSouthern EuropeSpainSri LankaSt. Vincent and the GrenadinesSudanSwedenSwitzerlandSyriaTaiwanThailandTrinidad and TobagoTurkeyUgandaUkraineUruguayUzbekistanVenezuelaVietnamWest IndiesWestern AfricaWestern AsiaWestern EuropeYemenZaireZimbabweAzores
Immigrants from Denmark
Race
Ancestry
AfghanAfricanAlaska NativeAlaskan AthabascanAlbanianAleutAlsatianAmericanApacheArabArapahoArgentineanArmenianAssyrian/Chaldean/SyriacAustralianAustrianBahamianBangladeshiBarbadianBasqueBelgianBelizeanBermudanBhutaneseBlackfeetBolivianBrazilianBritishBritish West IndianBulgarianBurmeseCajunCambodianCanadianCape VerdeanCarpatho RusynCelticCentral AmericanCentral American IndianCherokeeCheyenneChickasawChileanChineseChippewaChoctawColombianColvilleComancheCosta RicanCreeCreekCroatianCrowCubanCypriotCzechCzechoslovakianDanishDelawareDominicanDutchDutch West IndianEastern EuropeanEcuadorianEgyptianEnglishEthiopianEuropeanFijianFilipinoFinnishFrenchFrench American IndianFrench CanadianGermanGerman RussianGhanaianGreekGuamanian/ChamorroGuatemalanGuyaneseHaitianHmongHonduranHopiHoumaHungarianIcelanderIndian (Asian)IndonesianInupiatIranianIraqiIrishIroquoisIsraeliItalianJamaicanJapaneseJordanianKenyanKiowaKoreanLaotianLatvianLebaneseLiberianLithuanianLumbeeLuxembourgerMacedonianMalaysianMalteseMarshalleseMenomineeMexicanMexican American IndianMongolianMoroccanNative HawaiianNavajoNepaleseNew ZealanderNicaraguanNigerianNorthern EuropeanNorwegianOkinawanOsageOttawaPaiutePakistaniPalestinianPanamanianParaguayanPennsylvania GermanPeruvianPimaPolishPortuguesePotawatomiPuebloPuerto RicanPuget Sound SalishRomanianRussianSalvadoranSamoanScandinavianScotch-IrishScottishSeminoleSenegaleseSerbianShoshoneSierra LeoneanSiouxSlavicSlovakSloveneSomaliSouth AfricanSouth AmericanSouth American IndianSoviet UnionSpaniardSpanishSpanish AmericanSpanish American IndianSri LankanSubsaharan AfricanSudaneseSwedishSwissSyrianTaiwaneseThaiTlingit-HaidaTohono O'OdhamTonganTrinidadian and TobagonianTsimshianTurkishU.S. Virgin IslanderUgandanUkrainianUruguayanUteVenezuelanVietnameseWelshWest IndianYakamaYaquiYugoslavianYumanYup'ikZimbabwean
Immigration
NonimmigrantsImmigrantsAfghanistanAfricaAlbaniaArgentinaArmeniaAsiaAustraliaAustriaBahamasBangladeshBarbadosBelarusBelgiumBelizeBoliviaBosnia and HerzegovinaBrazilBulgariaBurma/MyanmarCabo VerdeCambodiaCameroonCanadaCaribbeanCentral AmericaChileChinaColombiaCongoCosta RicaCroatiaCubaCzechoslovakiaDenmarkDominicaDominican RepublicEastern AfricaEastern AsiaEastern EuropeEcuadorEgyptEl SalvadorEnglandEritreaEthiopiaEuropeFijiFranceGermanyGhanaGreeceGrenadaGuatemalaGuyanaHaitiHondurasHong KongHungaryIndiaIndonesiaIranIraqIrelandIsraelItalyJamaicaJapanJordanKazakhstanKenyaKoreaKuwaitLaosLatin AmericaLatviaLebanonLiberiaLithuaniaMalaysiaMexicoMicronesiaMiddle AfricaMoldovaMoroccoNepalNetherlandsNicaraguaNigeriaNorth AmericaNorth MacedoniaNorthern AfricaNorthern EuropeNorwayOceaniaPakistanPanamaPeruPhilippinesPolandPortugalRomaniaRussiaSaudi ArabiaScotlandSenegalSerbiaSierra LeoneSingaporeSomaliaSouth AfricaSouth AmericaSouth Central AsiaSouth Eastern AsiaSouthern EuropeSpainSri LankaSt. Vincent and the GrenadinesSudanSwedenSwitzerlandSyriaTaiwanThailandTrinidad and TobagoTurkeyUgandaUkraineUruguayUzbekistanVenezuelaVietnamWest IndiesWestern AfricaWestern AsiaWestern EuropeYemenZaireZimbabweAzores
Female Poverty
Income
Poverty
Unemployment
Labor Participation
Family Structure
Vehicle Availability
Education Level
Disability

Female Poverty Comparison

Estonians

Immigrants from Denmark

Exceptional
Exceptional
12.1%
FEMALE POVERTY
98.3/ 100
METRIC RATING
56th/ 347
METRIC RANK
12.4%
FEMALE POVERTY
95.8/ 100
METRIC RATING
90th/ 347
METRIC RANK

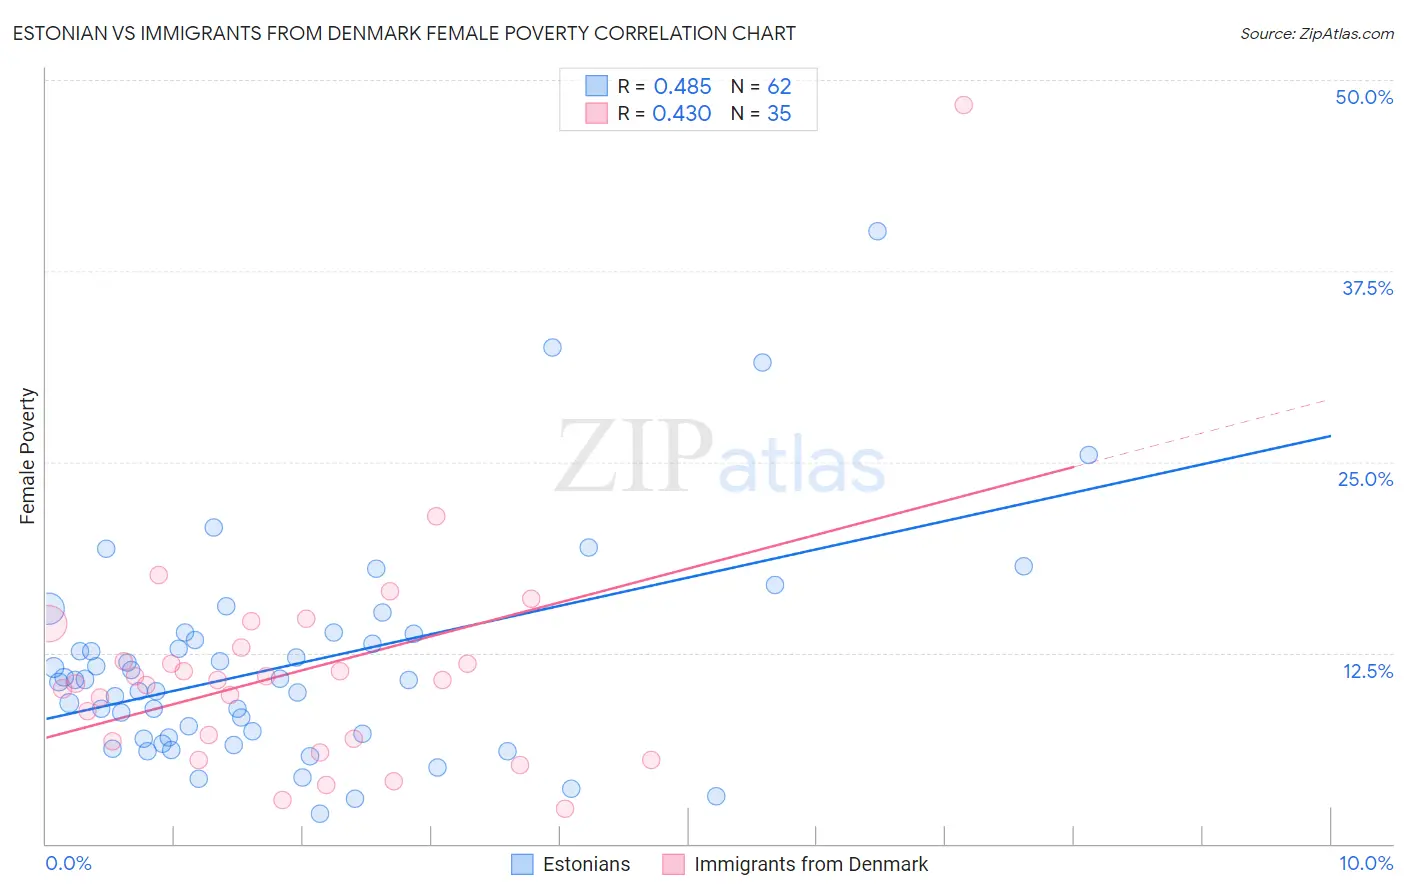
Estonian vs Immigrants from Denmark Female Poverty Correlation Chart

The statistical analysis conducted on geographies consisting of 123,486,564 people shows a moderate positive correlation between the proportion of Estonians and poverty level among females in the United States with a correlation coefficient (R) of 0.485 and weighted average of 12.1%. Similarly, the statistical analysis conducted on geographies consisting of 136,395,375 people shows a moderate positive correlation between the proportion of Immigrants from Denmark and poverty level among females in the United States with a correlation coefficient (R) of 0.430 and weighted average of 12.4%, a difference of 2.5%.
Estonian vs Immigrants from Denmark Female Poverty

Female Poverty Correlation Summary

MeasurementEstonianImmigrants from Denmark
Minimum1.9%2.3%
Maximum40.1%48.4%
Range38.2%46.1%
Mean11.7%11.2%
Median10.7%10.7%
Interquartile 25% (IQ1)7.0%6.7%
Interquartile 75% (IQ3)13.8%12.9%
Interquartile Range (IQR)6.8%6.1%
Standard Deviation (Sample)7.1%7.8%
Standard Deviation (Population)7.0%7.7%

Similar Demographics by Female Poverty

Demographics Similar to Estonians by Female Poverty

In terms of female poverty, the demographic groups most similar to Estonians are Immigrants from Serbia (12.1%, a difference of 0.060%), Scandinavian (12.1%, a difference of 0.14%), Immigrants from Europe (12.1%, a difference of 0.15%), Immigrants from Sri Lanka (12.1%, a difference of 0.25%), and Immigrants from Australia (12.2%, a difference of 0.39%).
DemographicsRating | RankFemale Poverty
Immigrants | Romania
99.0
/100
|
#49
Exceptional
12.0%
Slovenes
98.9
/100
|
#50
Exceptional
12.0%
Immigrants | Bulgaria
98.9
/100
|
#51
Exceptional
12.0%
Immigrants | Croatia
98.7
/100
|
#52
Exceptional
12.0%
Immigrants | Austria
98.7
/100
|
#53
Exceptional
12.0%
Immigrants | Philippines
98.7
/100
|
#54
Exceptional
12.1%
Immigrants | Sri Lanka
98.5
/100
|
#55
Exceptional
12.1%
Estonians
98.3
/100
|
#56
Exceptional
12.1%
Immigrants | Serbia
98.3
/100
|
#57
Exceptional
12.1%
Scandinavians
98.2
/100
|
#58
Exceptional
12.1%
Immigrants | Europe
98.2
/100
|
#59
Exceptional
12.1%
Immigrants | Australia
98.1
/100
|
#60
Exceptional
12.2%
Immigrants | Asia
98.1
/100
|
#61
Exceptional
12.2%
Immigrants | Italy
98.0
/100
|
#62
Exceptional
12.2%
Ukrainians
98.0
/100
|
#63
Exceptional
12.2%

Demographics Similar to Immigrants from Denmark by Female Poverty

In terms of female poverty, the demographic groups most similar to Immigrants from Denmark are Belgian (12.4%, a difference of 0.010%), Czechoslovakian (12.4%, a difference of 0.020%), Immigrants from Egypt (12.5%, a difference of 0.20%), English (12.4%, a difference of 0.22%), and Immigrants from Indonesia (12.5%, a difference of 0.22%).
DemographicsRating | RankFemale Poverty
Immigrants | England
96.9
/100
|
#83
Exceptional
12.3%
Northern Europeans
96.6
/100
|
#84
Exceptional
12.4%
Irish
96.5
/100
|
#85
Exceptional
12.4%
Dutch
96.5
/100
|
#86
Exceptional
12.4%
Okinawans
96.4
/100
|
#87
Exceptional
12.4%
Finns
96.4
/100
|
#88
Exceptional
12.4%
English
96.1
/100
|
#89
Exceptional
12.4%
Immigrants | Denmark
95.8
/100
|
#90
Exceptional
12.4%
Belgians
95.8
/100
|
#91
Exceptional
12.4%
Czechoslovakians
95.7
/100
|
#92
Exceptional
12.4%
Immigrants | Egypt
95.5
/100
|
#93
Exceptional
12.5%
Immigrants | Indonesia
95.4
/100
|
#94
Exceptional
12.5%
Immigrants | South Africa
95.4
/100
|
#95
Exceptional
12.5%
British
95.2
/100
|
#96
Exceptional
12.5%
Australians
95.2
/100
|
#97
Exceptional
12.5%