Ecuadorian vs Slavic Male Poverty
COMPARE
Ecuadorian
Slavic
Male Poverty
Male Poverty Comparison
Ecuadorians
Slavs
12.7%
MALE POVERTY
0.4/ 100
METRIC RATING
238th/ 347
METRIC RANK
10.5%
MALE POVERTY
91.7/ 100
METRIC RATING
103rd/ 347
METRIC RANK
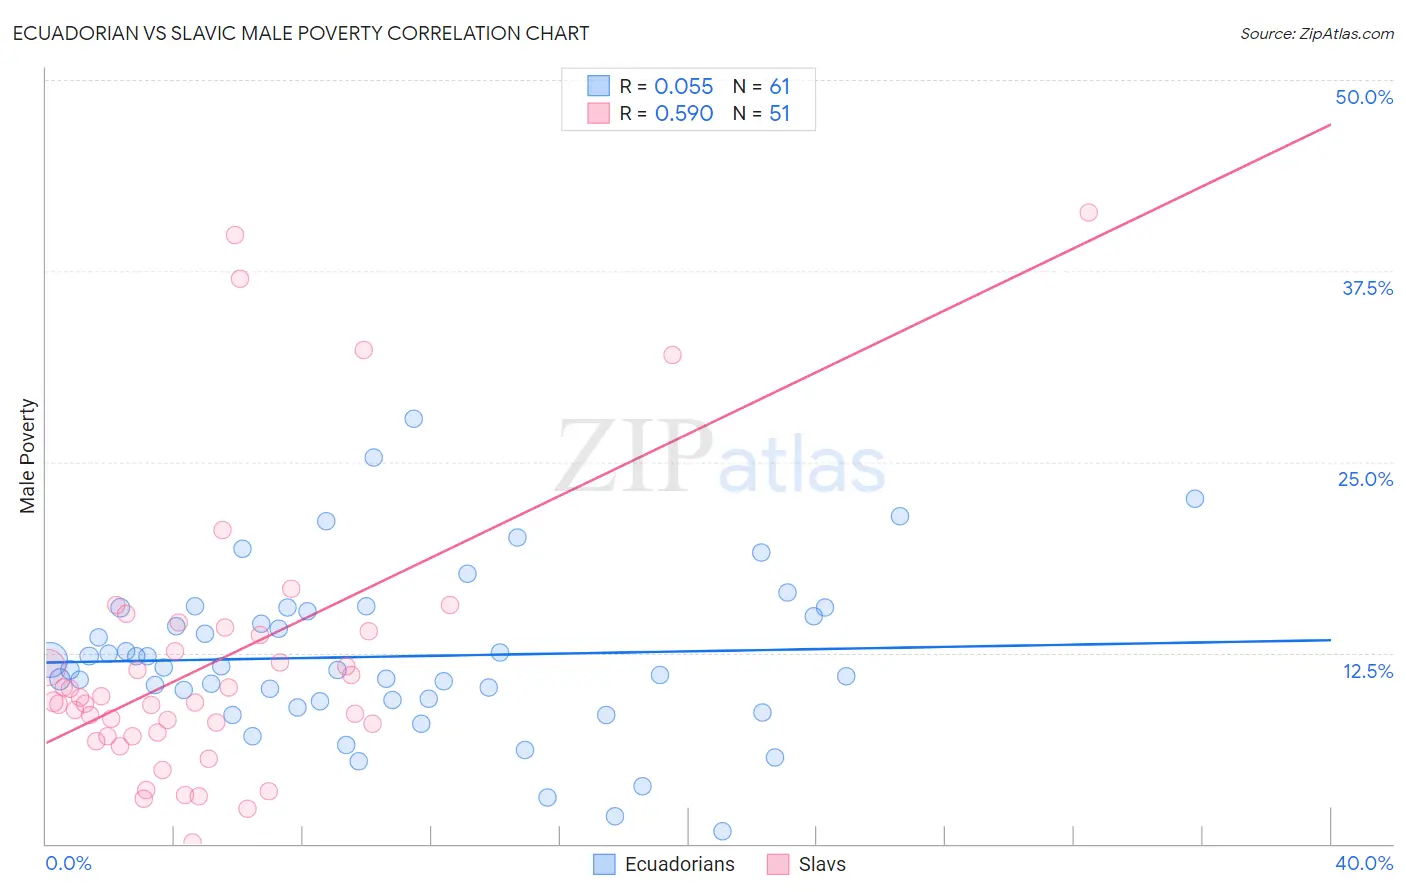
Ecuadorian vs Slavic Male Poverty Correlation Chart
The statistical analysis conducted on geographies consisting of 317,549,368 people shows a slight positive correlation between the proportion of Ecuadorians and poverty level among males in the United States with a correlation coefficient (R) of 0.055 and weighted average of 12.7%. Similarly, the statistical analysis conducted on geographies consisting of 270,742,219 people shows a substantial positive correlation between the proportion of Slavs and poverty level among males in the United States with a correlation coefficient (R) of 0.590 and weighted average of 10.5%, a difference of 20.4%.
Male Poverty Correlation Summary
| Measurement | Ecuadorian | Slavic |
| Minimum | 0.81% | 0.066% |
| Maximum | 27.8% | 41.3% |
| Range | 27.0% | 41.2% |
| Mean | 12.3% | 11.9% |
| Median | 11.6% | 9.3% |
| Interquartile 25% (IQ1) | 9.4% | 7.0% |
| Interquartile 75% (IQ3) | 15.3% | 13.9% |
| Interquartile Range (IQR) | 6.0% | 6.9% |
| Standard Deviation (Sample) | 5.3% | 9.2% |
| Standard Deviation (Population) | 5.3% | 9.1% |
Similar Demographics by Male Poverty
Demographics Similar to Ecuadorians by Male Poverty
In terms of male poverty, the demographic groups most similar to Ecuadorians are Ghanaian (12.7%, a difference of 0.0%), French American Indian (12.7%, a difference of 0.030%), Immigrants from Saudi Arabia (12.7%, a difference of 0.080%), Immigrants from Middle Africa (12.7%, a difference of 0.28%), and Immigrants from Laos (12.6%, a difference of 0.32%).
| Demographics | Rating | Rank | Male Poverty |
| Salvadorans | 0.6 /100 | #231 | Tragic 12.6% |
| Nicaraguans | 0.6 /100 | #232 | Tragic 12.6% |
| Fijians | 0.6 /100 | #233 | Tragic 12.6% |
| Immigrants | Armenia | 0.6 /100 | #234 | Tragic 12.6% |
| Immigrants | Laos | 0.5 /100 | #235 | Tragic 12.6% |
| Immigrants | Saudi Arabia | 0.4 /100 | #236 | Tragic 12.7% |
| French American Indians | 0.4 /100 | #237 | Tragic 12.7% |
| Ecuadorians | 0.4 /100 | #238 | Tragic 12.7% |
| Ghanaians | 0.4 /100 | #239 | Tragic 12.7% |
| Immigrants | Middle Africa | 0.4 /100 | #240 | Tragic 12.7% |
| Sudanese | 0.3 /100 | #241 | Tragic 12.8% |
| Nepalese | 0.3 /100 | #242 | Tragic 12.8% |
| Alaskan Athabascans | 0.3 /100 | #243 | Tragic 12.8% |
| Tsimshian | 0.3 /100 | #244 | Tragic 12.8% |
| Liberians | 0.3 /100 | #245 | Tragic 12.8% |
Demographics Similar to Slavs by Male Poverty
In terms of male poverty, the demographic groups most similar to Slavs are Welsh (10.5%, a difference of 0.010%), Canadian (10.5%, a difference of 0.020%), French Canadian (10.5%, a difference of 0.10%), Immigrants from Zimbabwe (10.5%, a difference of 0.11%), and Immigrants from Southern Europe (10.5%, a difference of 0.13%).
| Demographics | Rating | Rank | Male Poverty |
| Immigrants | Egypt | 93.7 /100 | #96 | Exceptional 10.4% |
| Romanians | 93.6 /100 | #97 | Exceptional 10.5% |
| Finns | 93.4 /100 | #98 | Exceptional 10.5% |
| Immigrants | Indonesia | 93.3 /100 | #99 | Exceptional 10.5% |
| Immigrants | Latvia | 92.8 /100 | #100 | Exceptional 10.5% |
| Immigrants | Zimbabwe | 92.0 /100 | #101 | Exceptional 10.5% |
| French Canadians | 91.9 /100 | #102 | Exceptional 10.5% |
| Slavs | 91.7 /100 | #103 | Exceptional 10.5% |
| Welsh | 91.6 /100 | #104 | Exceptional 10.5% |
| Canadians | 91.6 /100 | #105 | Exceptional 10.5% |
| Immigrants | Southern Europe | 91.3 /100 | #106 | Exceptional 10.5% |
| Laotians | 91.2 /100 | #107 | Exceptional 10.5% |
| Portuguese | 91.0 /100 | #108 | Exceptional 10.6% |
| Albanians | 90.6 /100 | #109 | Exceptional 10.6% |
| Argentineans | 90.1 /100 | #110 | Exceptional 10.6% |