Dutch West Indian vs Immigrants from Guatemala Poverty
COMPARE
Dutch West Indian
Immigrants from Guatemala
Poverty
Poverty Comparison
Dutch West Indians
Immigrants from Guatemala
15.6%
POVERTY
0.0/ 100
METRIC RATING
310th/ 347
METRIC RANK
15.5%
POVERTY
0.0/ 100
METRIC RATING
305th/ 347
METRIC RANK
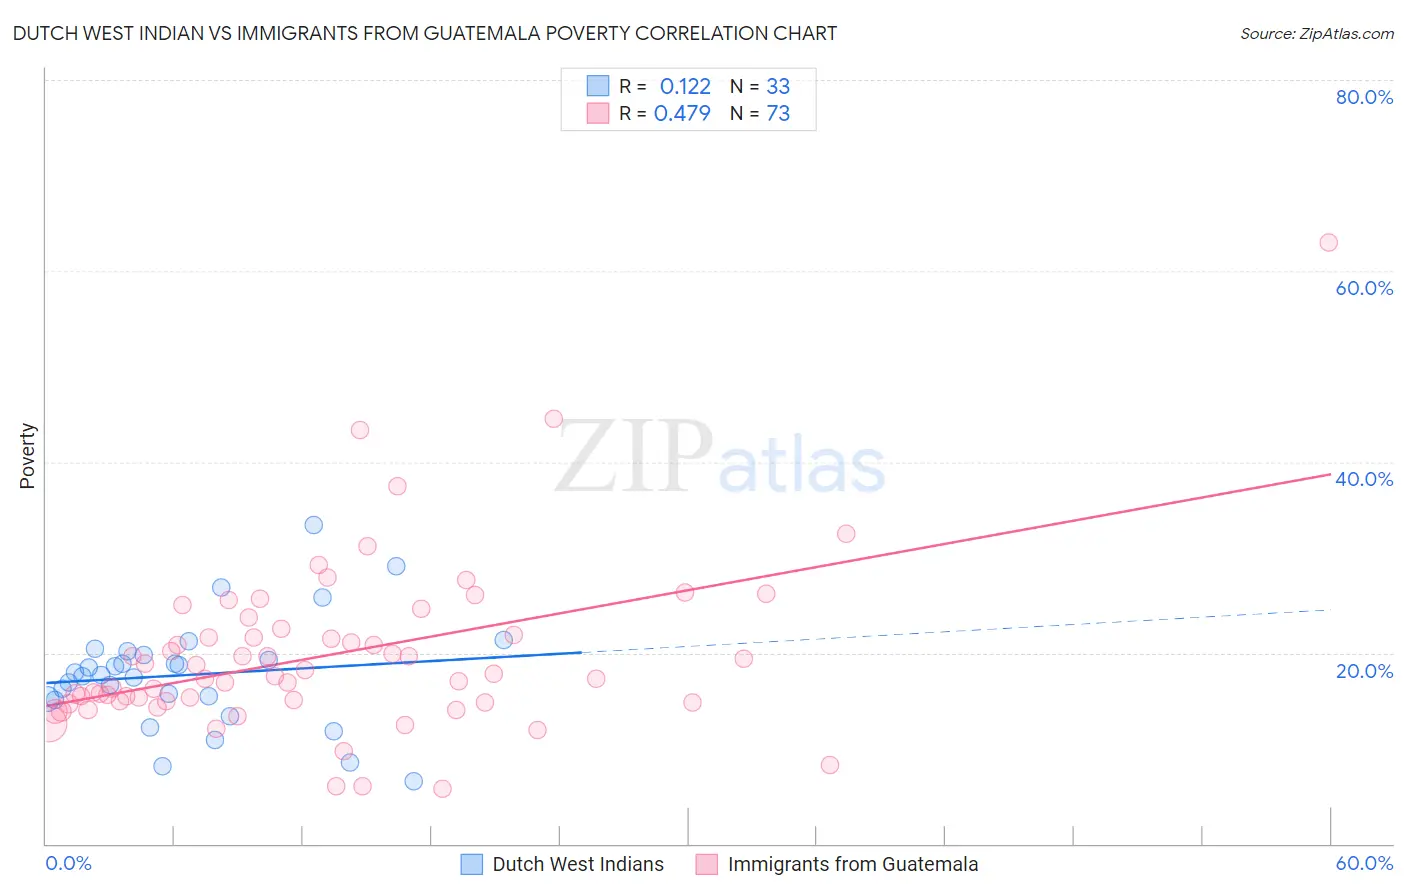
Dutch West Indian vs Immigrants from Guatemala Poverty Correlation Chart
The statistical analysis conducted on geographies consisting of 85,763,353 people shows a poor positive correlation between the proportion of Dutch West Indians and poverty level in the United States with a correlation coefficient (R) of 0.122 and weighted average of 15.6%. Similarly, the statistical analysis conducted on geographies consisting of 377,145,894 people shows a moderate positive correlation between the proportion of Immigrants from Guatemala and poverty level in the United States with a correlation coefficient (R) of 0.479 and weighted average of 15.5%, a difference of 0.76%.
Poverty Correlation Summary
| Measurement | Dutch West Indian | Immigrants from Guatemala |
| Minimum | 6.5% | 5.8% |
| Maximum | 33.3% | 62.9% |
| Range | 26.8% | 57.2% |
| Mean | 17.7% | 19.7% |
| Median | 17.7% | 17.5% |
| Interquartile 25% (IQ1) | 15.1% | 14.8% |
| Interquartile 75% (IQ3) | 20.0% | 22.2% |
| Interquartile Range (IQR) | 4.9% | 7.3% |
| Standard Deviation (Sample) | 5.7% | 8.9% |
| Standard Deviation (Population) | 5.6% | 8.9% |
Demographics Similar to Dutch West Indians and Immigrants from Guatemala by Poverty
In terms of poverty, the demographic groups most similar to Dutch West Indians are Seminole (15.6%, a difference of 0.090%), Choctaw (15.6%, a difference of 0.13%), African (15.6%, a difference of 0.24%), Creek (15.6%, a difference of 0.32%), and Chippewa (15.7%, a difference of 0.39%). Similarly, the demographic groups most similar to Immigrants from Guatemala are Immigrants from Mexico (15.5%, a difference of 0.030%), Immigrants from Caribbean (15.5%, a difference of 0.12%), Creek (15.6%, a difference of 0.44%), African (15.6%, a difference of 0.51%), and Somali (15.4%, a difference of 0.61%).
| Demographics | Rating | Rank | Poverty |
| Immigrants | Bangladesh | 0.0 /100 | #297 | Tragic 15.3% |
| Immigrants | Senegal | 0.0 /100 | #298 | Tragic 15.3% |
| Senegalese | 0.0 /100 | #299 | Tragic 15.3% |
| Immigrants | Central America | 0.0 /100 | #300 | Tragic 15.4% |
| Bahamians | 0.0 /100 | #301 | Tragic 15.4% |
| Somalis | 0.0 /100 | #302 | Tragic 15.4% |
| Immigrants | Caribbean | 0.0 /100 | #303 | Tragic 15.5% |
| Immigrants | Mexico | 0.0 /100 | #304 | Tragic 15.5% |
| Immigrants | Guatemala | 0.0 /100 | #305 | Tragic 15.5% |
| Creek | 0.0 /100 | #306 | Tragic 15.6% |
| Africans | 0.0 /100 | #307 | Tragic 15.6% |
| Choctaw | 0.0 /100 | #308 | Tragic 15.6% |
| Seminole | 0.0 /100 | #309 | Tragic 15.6% |
| Dutch West Indians | 0.0 /100 | #310 | Tragic 15.6% |
| Chippewa | 0.0 /100 | #311 | Tragic 15.7% |
| Cajuns | 0.0 /100 | #312 | Tragic 15.7% |
| Immigrants | Grenada | 0.0 /100 | #313 | Tragic 15.8% |
| Immigrants | Somalia | 0.0 /100 | #314 | Tragic 15.8% |
| British West Indians | 0.0 /100 | #315 | Tragic 15.9% |
| Hondurans | 0.0 /100 | #316 | Tragic 15.9% |
| U.S. Virgin Islanders | 0.0 /100 | #317 | Tragic 16.1% |