Dominican vs Assyrian/Chaldean/Syriac Seniors Poverty Over the Age of 75

COMPARE

Dominican
Race
Ancestry
AfghanAfricanAlaska NativeAlaskan AthabascanAlbanianAleutAlsatianAmericanApacheArabArapahoArgentineanArmenianAustralianAustrianBahamianBangladeshiBarbadianBasqueBelgianBelizeanBermudanBhutaneseBlackfeetBolivianBrazilianBritishBritish West IndianBulgarianBurmeseCajunCambodianCanadianCape VerdeanCarpatho RusynCelticCentral AmericanCentral American IndianCherokeeCheyenneChickasawChileanChineseChippewaChoctawColombianColvilleComancheCosta RicanCreeCreekCroatianCrowCubanCypriotCzechCzechoslovakianDanishDelawareDominicanDutchDutch West IndianEastern EuropeanEcuadorianEgyptianEnglishEstonianEthiopianEuropeanFijianFilipinoFinnishFrenchFrench American IndianFrench CanadianGermanGerman RussianGhanaianGreekGuamanian/ChamorroGuatemalanGuyaneseHaitianHmongHonduranHopiHoumaHungarianIcelanderIndian (Asian)IndonesianInupiatIranianIraqiIrishIroquoisIsraeliItalianJamaicanJapaneseJordanianKenyanKiowaKoreanLaotianLatvianLebaneseLiberianLithuanianLumbeeLuxembourgerMacedonianMalaysianMalteseMarshalleseMenomineeMexicanMexican American IndianMongolianMoroccanNative HawaiianNavajoNepaleseNew ZealanderNicaraguanNigerianNorthern EuropeanNorwegianOkinawanOsageOttawaPaiutePakistaniPalestinianPanamanianParaguayanPennsylvania GermanPeruvianPimaPolishPortuguesePotawatomiPuebloPuerto RicanPuget Sound SalishRomanianRussianSalvadoranSamoanScandinavianScotch-IrishScottishSeminoleSenegaleseSerbianShoshoneSierra LeoneanSiouxSlavicSlovakSloveneSomaliSouth AfricanSouth AmericanSouth American IndianSoviet UnionSpaniardSpanishSpanish AmericanSpanish American IndianSri LankanSubsaharan AfricanSudaneseSwedishSwissSyrianTaiwaneseThaiTlingit-HaidaTohono O'OdhamTonganTrinidadian and TobagonianTsimshianTurkishU.S. Virgin IslanderUgandanUkrainianUruguayanUteVenezuelanVietnameseWelshWest IndianYakamaYaquiYugoslavianYumanYup'ikZimbabwean
Immigration
NonimmigrantsImmigrantsAfghanistanAfricaAlbaniaArgentinaArmeniaAsiaAustraliaAustriaBahamasBangladeshBarbadosBelarusBelgiumBelizeBoliviaBosnia and HerzegovinaBrazilBulgariaBurma/MyanmarCabo VerdeCambodiaCameroonCanadaCaribbeanCentral AmericaChileChinaColombiaCongoCosta RicaCroatiaCubaCzechoslovakiaDenmarkDominicaDominican RepublicEastern AfricaEastern AsiaEastern EuropeEcuadorEgyptEl SalvadorEnglandEritreaEthiopiaEuropeFijiFranceGermanyGhanaGreeceGrenadaGuatemalaGuyanaHaitiHondurasHong KongHungaryIndiaIndonesiaIranIraqIrelandIsraelItalyJamaicaJapanJordanKazakhstanKenyaKoreaKuwaitLaosLatin AmericaLatviaLebanonLiberiaLithuaniaMalaysiaMexicoMicronesiaMiddle AfricaMoldovaMoroccoNepalNetherlandsNicaraguaNigeriaNorth AmericaNorth MacedoniaNorthern AfricaNorthern EuropeNorwayOceaniaPakistanPanamaPeruPhilippinesPolandPortugalRomaniaRussiaSaudi ArabiaScotlandSenegalSerbiaSierra LeoneSingaporeSomaliaSouth AfricaSouth AmericaSouth Central AsiaSouth Eastern AsiaSouthern EuropeSpainSri LankaSt. Vincent and the GrenadinesSudanSwedenSwitzerlandSyriaTaiwanThailandTrinidad and TobagoTurkeyUgandaUkraineUruguayUzbekistanVenezuelaVietnamWest IndiesWestern AfricaWestern AsiaWestern EuropeYemenZaireZimbabweAzores
Assyrian/Chaldean/Syriac
Race
Ancestry
AfghanAfricanAlaska NativeAlaskan AthabascanAlbanianAleutAlsatianAmericanApacheArabArapahoArgentineanArmenianAssyrian/Chaldean/SyriacAustralianAustrianBahamianBangladeshiBarbadianBasqueBelgianBelizeanBermudanBhutaneseBlackfeetBolivianBrazilianBritishBritish West IndianBulgarianBurmeseCajunCambodianCanadianCape VerdeanCarpatho RusynCelticCentral AmericanCentral American IndianCherokeeCheyenneChickasawChileanChineseChippewaChoctawColombianColvilleComancheCosta RicanCreeCreekCroatianCrowCubanCypriotCzechCzechoslovakianDanishDelawareDutchDutch West IndianEastern EuropeanEcuadorianEgyptianEnglishEstonianEthiopianEuropeanFijianFilipinoFinnishFrenchFrench American IndianFrench CanadianGermanGerman RussianGhanaianGreekGuamanian/ChamorroGuatemalanGuyaneseHaitianHmongHonduranHopiHoumaHungarianIcelanderIndian (Asian)IndonesianInupiatIranianIraqiIrishIroquoisIsraeliItalianJamaicanJapaneseJordanianKenyanKiowaKoreanLaotianLatvianLebaneseLiberianLithuanianLumbeeLuxembourgerMacedonianMalaysianMalteseMarshalleseMenomineeMexicanMexican American IndianMongolianMoroccanNative HawaiianNavajoNepaleseNew ZealanderNicaraguanNigerianNorthern EuropeanNorwegianOkinawanOsageOttawaPaiutePakistaniPalestinianPanamanianParaguayanPennsylvania GermanPeruvianPimaPolishPortuguesePotawatomiPuebloPuerto RicanPuget Sound SalishRomanianRussianSalvadoranSamoanScandinavianScotch-IrishScottishSeminoleSenegaleseSerbianShoshoneSierra LeoneanSiouxSlavicSlovakSloveneSomaliSouth AfricanSouth AmericanSouth American IndianSoviet UnionSpaniardSpanishSpanish AmericanSpanish American IndianSri LankanSubsaharan AfricanSudaneseSwedishSwissSyrianTaiwaneseThaiTlingit-HaidaTohono O'OdhamTonganTrinidadian and TobagonianTsimshianTurkishU.S. Virgin IslanderUgandanUkrainianUruguayanUteVenezuelanVietnameseWelshWest IndianYakamaYaquiYugoslavianYumanYup'ikZimbabwean
Immigration
NonimmigrantsImmigrantsAfghanistanAfricaAlbaniaArgentinaArmeniaAsiaAustraliaAustriaBahamasBangladeshBarbadosBelarusBelgiumBelizeBoliviaBosnia and HerzegovinaBrazilBulgariaBurma/MyanmarCabo VerdeCambodiaCameroonCanadaCaribbeanCentral AmericaChileChinaColombiaCongoCosta RicaCroatiaCubaCzechoslovakiaDenmarkDominicaDominican RepublicEastern AfricaEastern AsiaEastern EuropeEcuadorEgyptEl SalvadorEnglandEritreaEthiopiaEuropeFijiFranceGermanyGhanaGreeceGrenadaGuatemalaGuyanaHaitiHondurasHong KongHungaryIndiaIndonesiaIranIraqIrelandIsraelItalyJamaicaJapanJordanKazakhstanKenyaKoreaKuwaitLaosLatin AmericaLatviaLebanonLiberiaLithuaniaMalaysiaMexicoMicronesiaMiddle AfricaMoldovaMoroccoNepalNetherlandsNicaraguaNigeriaNorth AmericaNorth MacedoniaNorthern AfricaNorthern EuropeNorwayOceaniaPakistanPanamaPeruPhilippinesPolandPortugalRomaniaRussiaSaudi ArabiaScotlandSenegalSerbiaSierra LeoneSingaporeSomaliaSouth AfricaSouth AmericaSouth Central AsiaSouth Eastern AsiaSouthern EuropeSpainSri LankaSt. Vincent and the GrenadinesSudanSwedenSwitzerlandSyriaTaiwanThailandTrinidad and TobagoTurkeyUgandaUkraineUruguayUzbekistanVenezuelaVietnamWest IndiesWestern AfricaWestern AsiaWestern EuropeYemenZaireZimbabweAzores
Seniors Poverty Over the Age of 75
Income
Poverty
Unemployment
Labor Participation
Family Structure
Vehicle Availability
Education Level
Disability

Seniors Poverty Over the Age of 75 Comparison

Dominicans

Assyrians/Chaldeans/Syriacs

Tragic
Exceptional
19.6%
SENIORS POVERTY OVER THE AGE OF 75
0.0/ 100
METRIC RATING
342nd/ 347
METRIC RANK
10.7%
SENIORS POVERTY OVER THE AGE OF 75
99.8/ 100
METRIC RATING
29th/ 347
METRIC RANK

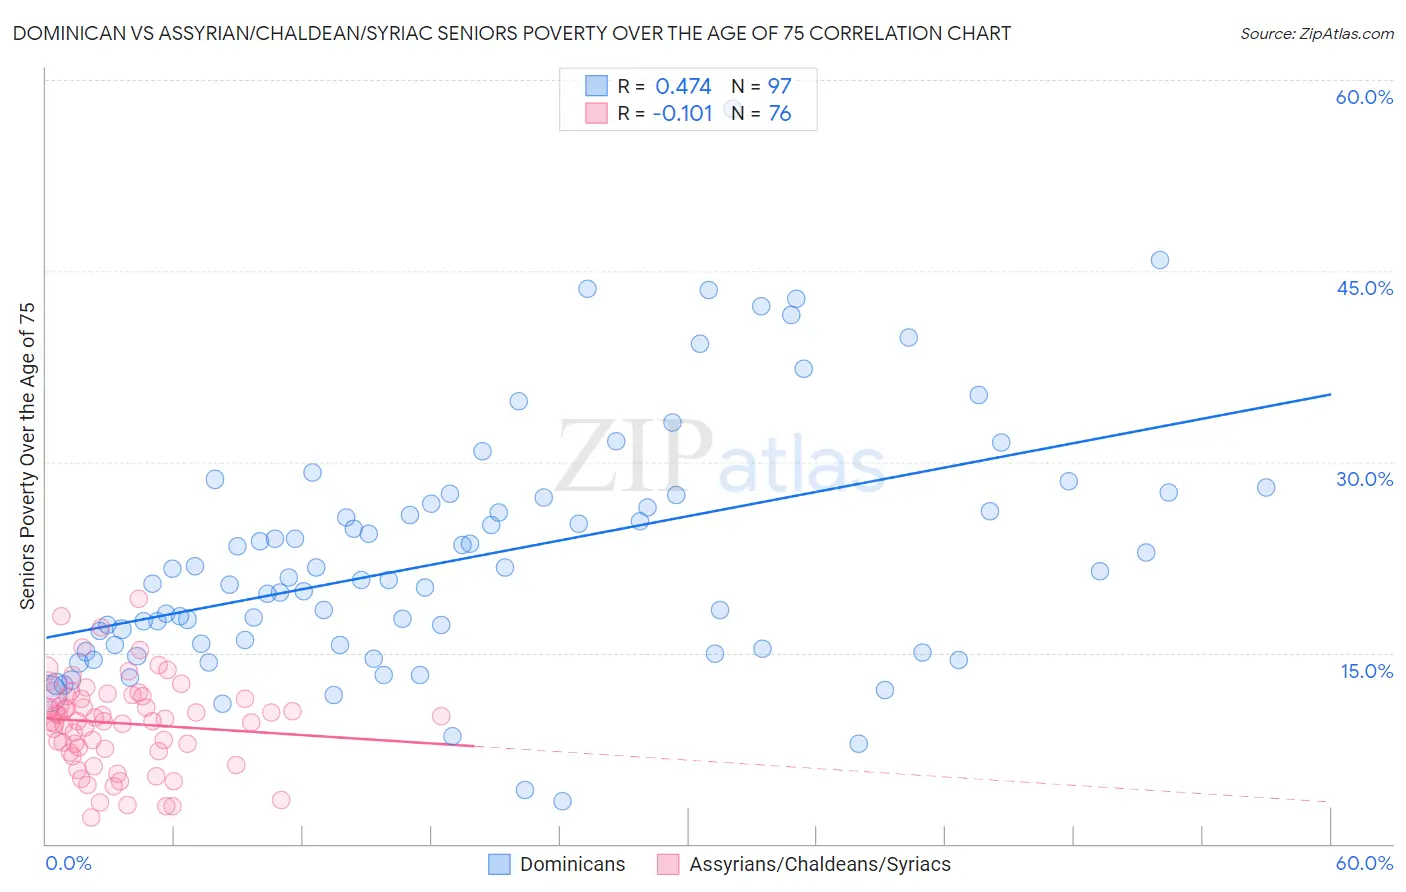
Dominican vs Assyrian/Chaldean/Syriac Seniors Poverty Over the Age of 75 Correlation Chart

The statistical analysis conducted on geographies consisting of 350,851,052 people shows a moderate positive correlation between the proportion of Dominicans and poverty level among seniors over the age of 75 in the United States with a correlation coefficient (R) of 0.474 and weighted average of 19.6%. Similarly, the statistical analysis conducted on geographies consisting of 109,878,475 people shows a poor negative correlation between the proportion of Assyrians/Chaldeans/Syriacs and poverty level among seniors over the age of 75 in the United States with a correlation coefficient (R) of -0.101 and weighted average of 10.7%, a difference of 83.3%.
Dominican vs Assyrian/Chaldean/Syriac Seniors Poverty Over the Age of 75

Seniors Poverty Over the Age of 75 Correlation Summary

MeasurementDominicanAssyrian/Chaldean/Syriac
Minimum3.4%2.1%
Maximum57.7%19.3%
Range54.4%17.2%
Mean22.5%9.5%
Median20.8%9.7%
Interquartile 25% (IQ1)15.5%7.4%
Interquartile 75% (IQ3)27.0%11.6%
Interquartile Range (IQR)11.5%4.2%
Standard Deviation (Sample)9.7%3.5%
Standard Deviation (Population)9.6%3.5%

Similar Demographics by Seniors Poverty Over the Age of 75

Demographics Similar to Dominicans by Seniors Poverty Over the Age of 75

In terms of seniors poverty over the age of 75, the demographic groups most similar to Dominicans are Lumbee (19.7%, a difference of 0.66%), Navajo (19.4%, a difference of 1.2%), Immigrants from Cuba (19.9%, a difference of 1.5%), Immigrants from Dominican Republic (20.1%, a difference of 2.2%), and Tohono O'odham (19.1%, a difference of 2.5%).
DemographicsRating | RankSeniors Poverty Over the Age of 75
Immigrants | Nicaragua
0.0
/100
|
#333
Tragic
17.6%
Immigrants | Grenada
0.0
/100
|
#334
Tragic
17.8%
Cubans
0.0
/100
|
#335
Tragic
18.0%
Immigrants | Caribbean
0.0
/100
|
#336
Tragic
18.2%
Yakama
0.0
/100
|
#337
Tragic
18.3%
Immigrants | Cabo Verde
0.0
/100
|
#338
Tragic
18.5%
Hopi
0.0
/100
|
#339
Tragic
18.9%
Tohono O'odham
0.0
/100
|
#340
Tragic
19.1%
Navajo
0.0
/100
|
#341
Tragic
19.4%
Dominicans
0.0
/100
|
#342
Tragic
19.6%
Lumbee
0.0
/100
|
#343
Tragic
19.7%
Immigrants | Cuba
0.0
/100
|
#344
Tragic
19.9%
Immigrants | Dominican Republic
0.0
/100
|
#345
Tragic
20.1%
Puerto Ricans
0.0
/100
|
#346
Tragic
23.2%
Pima
0.0
/100
|
#347
Tragic
23.9%

Demographics Similar to Assyrians/Chaldeans/Syriacs by Seniors Poverty Over the Age of 75

In terms of seniors poverty over the age of 75, the demographic groups most similar to Assyrians/Chaldeans/Syriacs are Swiss (10.7%, a difference of 0.080%), Irish (10.7%, a difference of 0.15%), Northern European (10.7%, a difference of 0.21%), Marshallese (10.7%, a difference of 0.26%), and British (10.7%, a difference of 0.40%).
DemographicsRating | RankSeniors Poverty Over the Age of 75
Bhutanese
99.8
/100
|
#22
Exceptional
10.6%
Lithuanians
99.8
/100
|
#23
Exceptional
10.6%
Poles
99.8
/100
|
#24
Exceptional
10.6%
Menominee
99.8
/100
|
#25
Exceptional
10.6%
Bulgarians
99.8
/100
|
#26
Exceptional
10.7%
Northern Europeans
99.8
/100
|
#27
Exceptional
10.7%
Irish
99.8
/100
|
#28
Exceptional
10.7%
Assyrians/Chaldeans/Syriacs
99.8
/100
|
#29
Exceptional
10.7%
Swiss
99.7
/100
|
#30
Exceptional
10.7%
Marshallese
99.7
/100
|
#31
Exceptional
10.7%
British
99.7
/100
|
#32
Exceptional
10.7%
Puget Sound Salish
99.7
/100
|
#33
Exceptional
10.8%
Italians
99.7
/100
|
#34
Exceptional
10.8%
Luxembourgers
99.6
/100
|
#35
Exceptional
10.8%
Scotch-Irish
99.6
/100
|
#36
Exceptional
10.8%