Delaware vs Mongolian Child Poverty Among Boys Under 16
COMPARE
Delaware
Mongolian
Child Poverty Among Boys Under 16
Child Poverty Among Boys Under 16 Comparison
Delaware
Mongolians
17.1%
CHILD POVERTY AMONG BOYS UNDER 16
18.8/ 100
METRIC RATING
199th/ 347
METRIC RANK
15.4%
CHILD POVERTY AMONG BOYS UNDER 16
90.2/ 100
METRIC RATING
130th/ 347
METRIC RANK
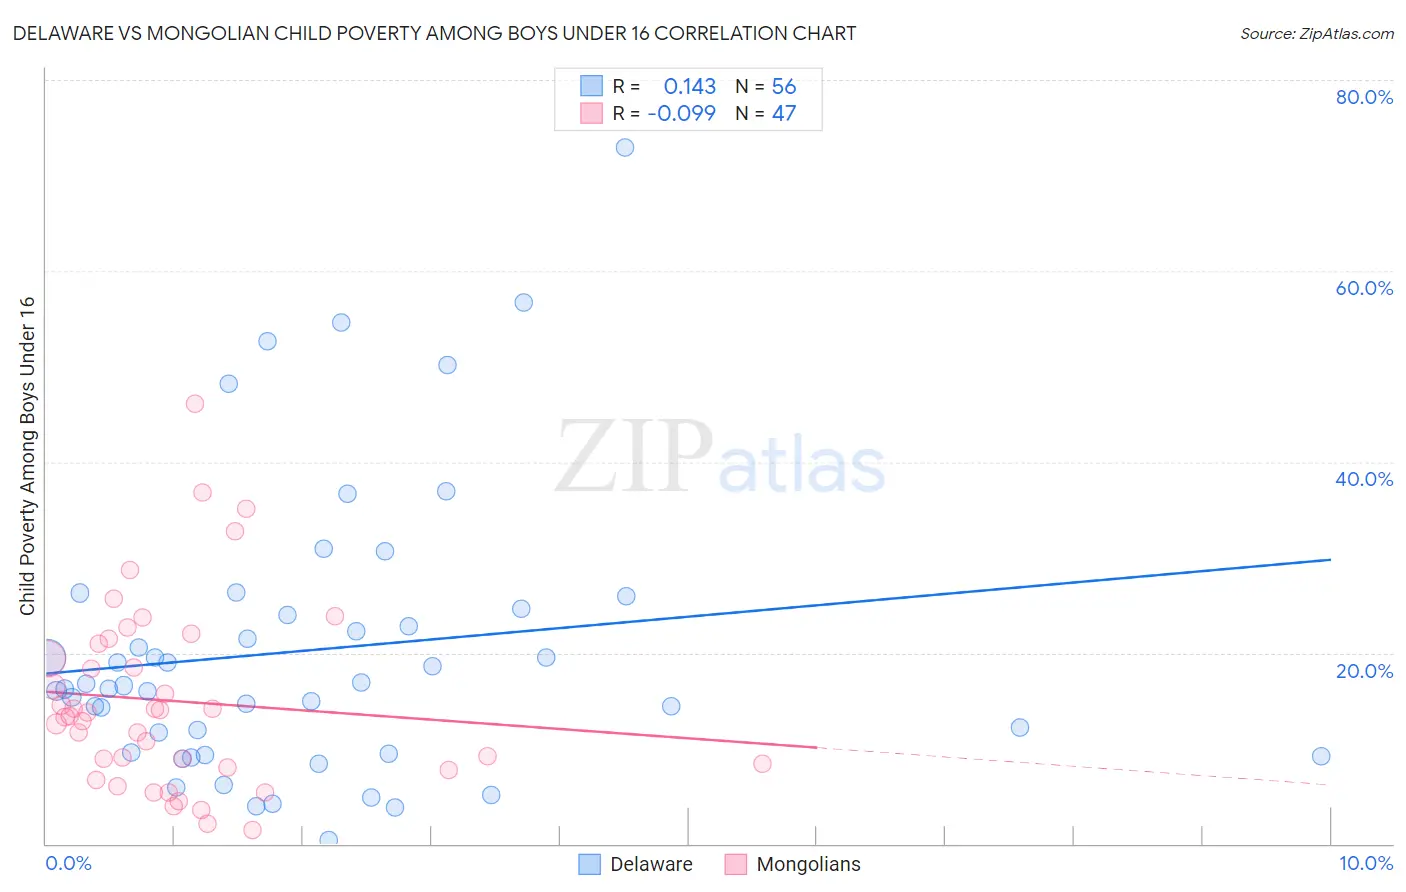
Delaware vs Mongolian Child Poverty Among Boys Under 16 Correlation Chart
The statistical analysis conducted on geographies consisting of 95,638,323 people shows a poor positive correlation between the proportion of Delaware and poverty level among boys under the age of 16 in the United States with a correlation coefficient (R) of 0.143 and weighted average of 17.1%. Similarly, the statistical analysis conducted on geographies consisting of 139,635,947 people shows a slight negative correlation between the proportion of Mongolians and poverty level among boys under the age of 16 in the United States with a correlation coefficient (R) of -0.099 and weighted average of 15.4%, a difference of 11.0%.
Child Poverty Among Boys Under 16 Correlation Summary
| Measurement | Delaware | Mongolian |
| Minimum | 0.35% | 1.5% |
| Maximum | 73.0% | 46.2% |
| Range | 72.6% | 44.7% |
| Mean | 20.3% | 15.0% |
| Median | 16.4% | 13.4% |
| Interquartile 25% (IQ1) | 9.5% | 7.9% |
| Interquartile 75% (IQ3) | 24.3% | 21.0% |
| Interquartile Range (IQR) | 14.8% | 13.1% |
| Standard Deviation (Sample) | 15.0% | 9.7% |
| Standard Deviation (Population) | 14.9% | 9.6% |
Similar Demographics by Child Poverty Among Boys Under 16
Demographics Similar to Delaware by Child Poverty Among Boys Under 16
In terms of child poverty among boys under 16, the demographic groups most similar to Delaware are Immigrants from Cameroon (17.1%, a difference of 0.040%), Immigrants from Kenya (17.1%, a difference of 0.23%), Spaniard (17.1%, a difference of 0.30%), Immigrants from Uruguay (17.2%, a difference of 0.33%), and Spanish (17.0%, a difference of 0.34%).
| Demographics | Rating | Rank | Child Poverty Among Boys Under 16 |
| Immigrants | Uganda | 21.6 /100 | #192 | Fair 17.0% |
| Immigrants | Iraq | 21.6 /100 | #193 | Fair 17.0% |
| Immigrants | Lebanon | 21.2 /100 | #194 | Fair 17.0% |
| Spanish | 20.8 /100 | #195 | Fair 17.0% |
| Spaniards | 20.5 /100 | #196 | Fair 17.1% |
| Immigrants | Kenya | 20.1 /100 | #197 | Fair 17.1% |
| Immigrants | Cameroon | 19.0 /100 | #198 | Poor 17.1% |
| Delaware | 18.8 /100 | #199 | Poor 17.1% |
| Immigrants | Uruguay | 16.9 /100 | #200 | Poor 17.2% |
| Immigrants | Afghanistan | 13.7 /100 | #201 | Poor 17.3% |
| Immigrants | Sierra Leone | 13.4 /100 | #202 | Poor 17.3% |
| Immigrants | Uzbekistan | 13.3 /100 | #203 | Poor 17.3% |
| Ugandans | 12.5 /100 | #204 | Poor 17.3% |
| Immigrants | Portugal | 11.2 /100 | #205 | Poor 17.4% |
| German Russians | 10.9 /100 | #206 | Poor 17.4% |
Demographics Similar to Mongolians by Child Poverty Among Boys Under 16
In terms of child poverty among boys under 16, the demographic groups most similar to Mongolians are Immigrants from Brazil (15.4%, a difference of 0.020%), Immigrants from Western Europe (15.4%, a difference of 0.060%), Canadian (15.4%, a difference of 0.14%), Carpatho Rusyn (15.4%, a difference of 0.33%), and Palestinian (15.4%, a difference of 0.38%).
| Demographics | Rating | Rank | Child Poverty Among Boys Under 16 |
| Immigrants | Norway | 92.3 /100 | #123 | Exceptional 15.3% |
| Tlingit-Haida | 92.2 /100 | #124 | Exceptional 15.3% |
| Czechoslovakians | 92.1 /100 | #125 | Exceptional 15.3% |
| Palestinians | 91.3 /100 | #126 | Exceptional 15.4% |
| Carpatho Rusyns | 91.1 /100 | #127 | Exceptional 15.4% |
| Canadians | 90.6 /100 | #128 | Exceptional 15.4% |
| Immigrants | Brazil | 90.3 /100 | #129 | Exceptional 15.4% |
| Mongolians | 90.2 /100 | #130 | Exceptional 15.4% |
| Immigrants | Western Europe | 90.0 /100 | #131 | Exceptional 15.4% |
| Immigrants | Kazakhstan | 88.7 /100 | #132 | Excellent 15.5% |
| Welsh | 88.3 /100 | #133 | Excellent 15.5% |
| Peruvians | 88.1 /100 | #134 | Excellent 15.5% |
| Portuguese | 87.5 /100 | #135 | Excellent 15.5% |
| Icelanders | 87.5 /100 | #136 | Excellent 15.5% |
| Immigrants | Spain | 87.1 /100 | #137 | Excellent 15.6% |