Delaware vs Japanese Child Poverty Among Boys Under 16
COMPARE
Delaware
Japanese
Child Poverty Among Boys Under 16
Child Poverty Among Boys Under 16 Comparison
Delaware
Japanese
17.1%
CHILD POVERTY AMONG BOYS UNDER 16
18.8/ 100
METRIC RATING
199th/ 347
METRIC RANK
17.7%
CHILD POVERTY AMONG BOYS UNDER 16
5.5/ 100
METRIC RATING
217th/ 347
METRIC RANK
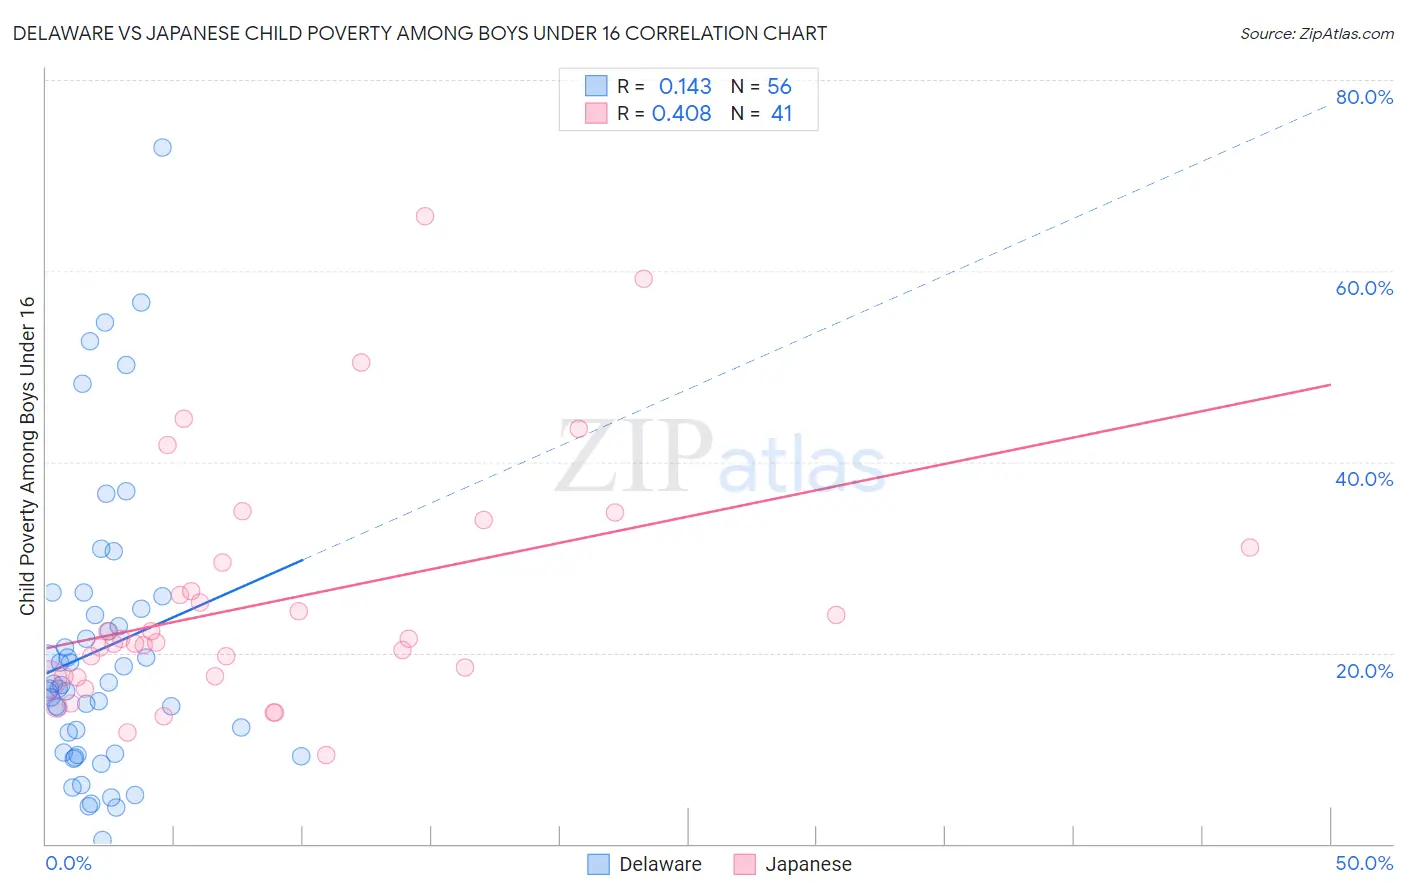
Delaware vs Japanese Child Poverty Among Boys Under 16 Correlation Chart
The statistical analysis conducted on geographies consisting of 95,638,323 people shows a poor positive correlation between the proportion of Delaware and poverty level among boys under the age of 16 in the United States with a correlation coefficient (R) of 0.143 and weighted average of 17.1%. Similarly, the statistical analysis conducted on geographies consisting of 247,557,395 people shows a moderate positive correlation between the proportion of Japanese and poverty level among boys under the age of 16 in the United States with a correlation coefficient (R) of 0.408 and weighted average of 17.7%, a difference of 3.7%.
Child Poverty Among Boys Under 16 Correlation Summary
| Measurement | Delaware | Japanese |
| Minimum | 0.35% | 9.3% |
| Maximum | 73.0% | 65.7% |
| Range | 72.6% | 56.4% |
| Mean | 20.3% | 25.4% |
| Median | 16.4% | 21.1% |
| Interquartile 25% (IQ1) | 9.5% | 17.5% |
| Interquartile 75% (IQ3) | 24.3% | 30.2% |
| Interquartile Range (IQR) | 14.8% | 12.7% |
| Standard Deviation (Sample) | 15.0% | 12.6% |
| Standard Deviation (Population) | 14.9% | 12.5% |
Demographics Similar to Delaware and Japanese by Child Poverty Among Boys Under 16
In terms of child poverty among boys under 16, the demographic groups most similar to Delaware are Immigrants from Cameroon (17.1%, a difference of 0.040%), Immigrants from Uruguay (17.2%, a difference of 0.33%), Immigrants from Afghanistan (17.3%, a difference of 1.0%), Immigrants from Sierra Leone (17.3%, a difference of 1.1%), and Immigrants from Uzbekistan (17.3%, a difference of 1.1%). Similarly, the demographic groups most similar to Japanese are Iraqi (17.7%, a difference of 0.020%), Moroccan (17.7%, a difference of 0.030%), Osage (17.7%, a difference of 0.12%), Panamanian (17.7%, a difference of 0.19%), and Immigrants from Eastern Africa (17.7%, a difference of 0.20%).
| Demographics | Rating | Rank | Child Poverty Among Boys Under 16 |
| Immigrants | Cameroon | 19.0 /100 | #198 | Poor 17.1% |
| Delaware | 18.8 /100 | #199 | Poor 17.1% |
| Immigrants | Uruguay | 16.9 /100 | #200 | Poor 17.2% |
| Immigrants | Afghanistan | 13.7 /100 | #201 | Poor 17.3% |
| Immigrants | Sierra Leone | 13.4 /100 | #202 | Poor 17.3% |
| Immigrants | Uzbekistan | 13.3 /100 | #203 | Poor 17.3% |
| Ugandans | 12.5 /100 | #204 | Poor 17.3% |
| Immigrants | Portugal | 11.2 /100 | #205 | Poor 17.4% |
| German Russians | 10.9 /100 | #206 | Poor 17.4% |
| Immigrants | Thailand | 8.2 /100 | #207 | Tragic 17.5% |
| Malaysians | 7.6 /100 | #208 | Tragic 17.6% |
| Alaskan Athabascans | 7.3 /100 | #209 | Tragic 17.6% |
| Immigrants | Armenia | 6.8 /100 | #210 | Tragic 17.6% |
| Immigrants | Immigrants | 6.7 /100 | #211 | Tragic 17.6% |
| Aleuts | 6.6 /100 | #212 | Tragic 17.7% |
| Immigrants | Eastern Africa | 6.0 /100 | #213 | Tragic 17.7% |
| Panamanians | 5.9 /100 | #214 | Tragic 17.7% |
| Osage | 5.8 /100 | #215 | Tragic 17.7% |
| Moroccans | 5.6 /100 | #216 | Tragic 17.7% |
| Japanese | 5.5 /100 | #217 | Tragic 17.7% |
| Iraqis | 5.5 /100 | #218 | Tragic 17.7% |