Choctaw vs Central American Seniors Poverty Over the Age of 75
COMPARE
Choctaw
Central American
Seniors Poverty Over the Age of 75
Seniors Poverty Over the Age of 75 Comparison
Choctaw
Central Americans
12.5%
SENIORS POVERTY OVER THE AGE OF 75
20.2/ 100
METRIC RATING
192nd/ 347
METRIC RANK
14.7%
SENIORS POVERTY OVER THE AGE OF 75
0.0/ 100
METRIC RATING
280th/ 347
METRIC RANK
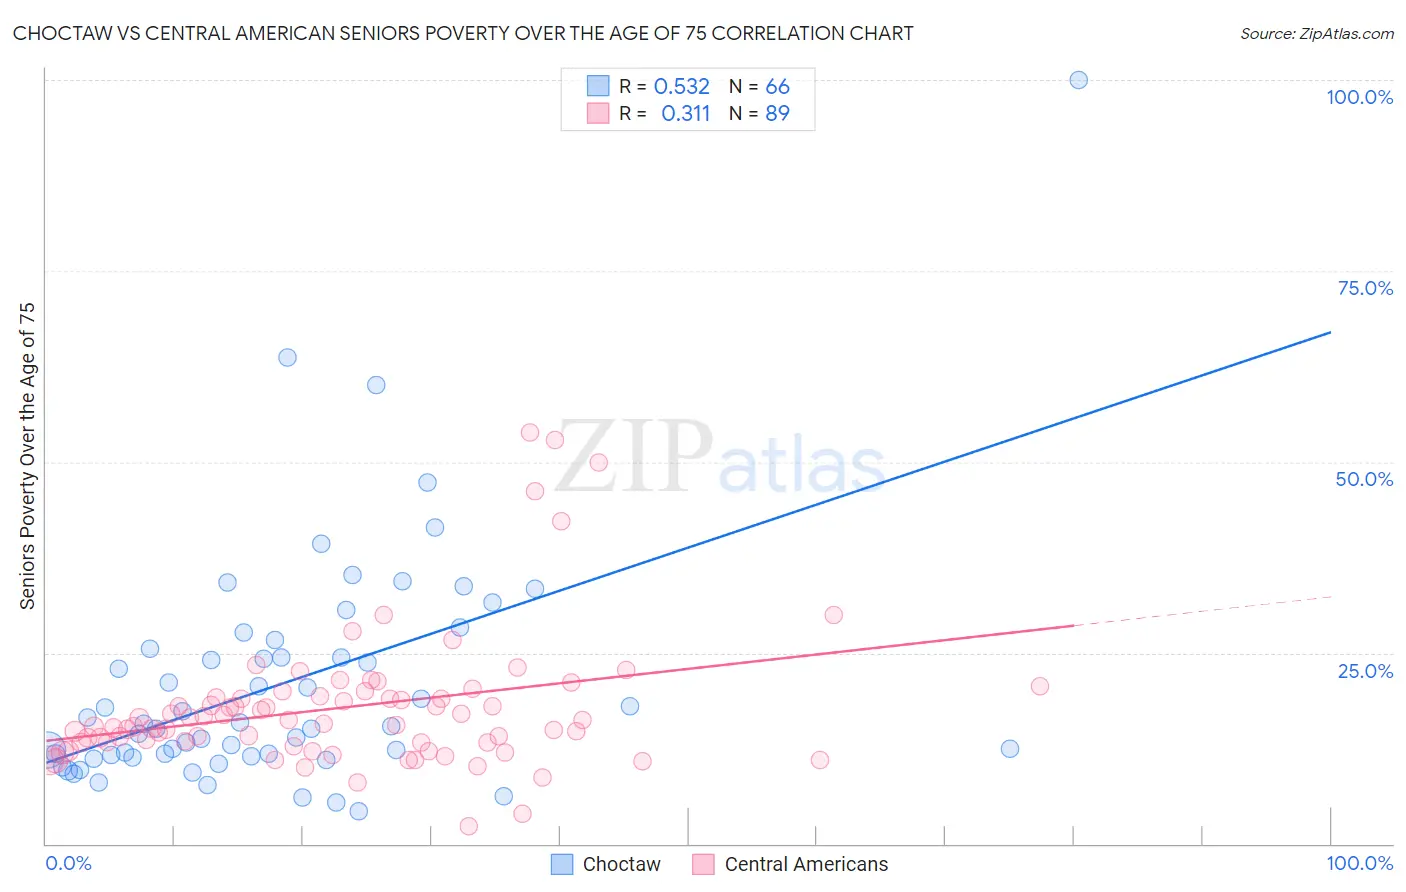
Choctaw vs Central American Seniors Poverty Over the Age of 75 Correlation Chart
The statistical analysis conducted on geographies consisting of 267,399,260 people shows a substantial positive correlation between the proportion of Choctaw and poverty level among seniors over the age of 75 in the United States with a correlation coefficient (R) of 0.532 and weighted average of 12.5%. Similarly, the statistical analysis conducted on geographies consisting of 495,711,598 people shows a mild positive correlation between the proportion of Central Americans and poverty level among seniors over the age of 75 in the United States with a correlation coefficient (R) of 0.311 and weighted average of 14.7%, a difference of 17.6%.
Seniors Poverty Over the Age of 75 Correlation Summary
| Measurement | Choctaw | Central American |
| Minimum | 4.2% | 2.3% |
| Maximum | 100.0% | 53.8% |
| Range | 95.8% | 51.5% |
| Mean | 20.9% | 17.8% |
| Median | 15.6% | 15.7% |
| Interquartile 25% (IQ1) | 11.6% | 13.2% |
| Interquartile 75% (IQ3) | 25.5% | 19.2% |
| Interquartile Range (IQR) | 13.9% | 6.0% |
| Standard Deviation (Sample) | 15.7% | 9.1% |
| Standard Deviation (Population) | 15.6% | 9.0% |
Similar Demographics by Seniors Poverty Over the Age of 75
Demographics Similar to Choctaw by Seniors Poverty Over the Age of 75
In terms of seniors poverty over the age of 75, the demographic groups most similar to Choctaw are Taiwanese (12.6%, a difference of 0.31%), Alsatian (12.6%, a difference of 0.32%), Liberian (12.5%, a difference of 0.35%), Immigrants from France (12.6%, a difference of 0.37%), and Immigrants from Congo (12.5%, a difference of 0.42%).
| Demographics | Rating | Rank | Seniors Poverty Over the Age of 75 |
| Immigrants | Malaysia | 35.8 /100 | #185 | Fair 12.3% |
| Sri Lankans | 32.3 /100 | #186 | Fair 12.4% |
| Yaqui | 25.9 /100 | #187 | Fair 12.5% |
| Immigrants | Northern Africa | 25.2 /100 | #188 | Fair 12.5% |
| Immigrants | Indonesia | 24.4 /100 | #189 | Fair 12.5% |
| Immigrants | Congo | 23.9 /100 | #190 | Fair 12.5% |
| Liberians | 23.2 /100 | #191 | Fair 12.5% |
| Choctaw | 20.2 /100 | #192 | Fair 12.5% |
| Taiwanese | 17.8 /100 | #193 | Poor 12.6% |
| Alsatians | 17.7 /100 | #194 | Poor 12.6% |
| Immigrants | France | 17.4 /100 | #195 | Poor 12.6% |
| Immigrants | Eastern Europe | 16.0 /100 | #196 | Poor 12.6% |
| Nepalese | 14.4 /100 | #197 | Poor 12.6% |
| Chileans | 13.7 /100 | #198 | Poor 12.6% |
| Immigrants | Lebanon | 12.7 /100 | #199 | Poor 12.7% |
Demographics Similar to Central Americans by Seniors Poverty Over the Age of 75
In terms of seniors poverty over the age of 75, the demographic groups most similar to Central Americans are Belizean (14.8%, a difference of 0.12%), Immigrants from Senegal (14.8%, a difference of 0.29%), Guatemalan (14.8%, a difference of 0.35%), Black/African American (14.6%, a difference of 0.64%), and Immigrants from Colombia (14.6%, a difference of 0.85%).
| Demographics | Rating | Rank | Seniors Poverty Over the Age of 75 |
| Immigrants | South America | 0.0 /100 | #273 | Tragic 14.4% |
| Immigrants | Bahamas | 0.0 /100 | #274 | Tragic 14.4% |
| Immigrants | El Salvador | 0.0 /100 | #275 | Tragic 14.5% |
| Soviet Union | 0.0 /100 | #276 | Tragic 14.5% |
| Senegalese | 0.0 /100 | #277 | Tragic 14.5% |
| Immigrants | Colombia | 0.0 /100 | #278 | Tragic 14.6% |
| Blacks/African Americans | 0.0 /100 | #279 | Tragic 14.6% |
| Central Americans | 0.0 /100 | #280 | Tragic 14.7% |
| Belizeans | 0.0 /100 | #281 | Tragic 14.8% |
| Immigrants | Senegal | 0.0 /100 | #282 | Tragic 14.8% |
| Guatemalans | 0.0 /100 | #283 | Tragic 14.8% |
| Cheyenne | 0.0 /100 | #284 | Tragic 14.9% |
| Immigrants | Mexico | 0.0 /100 | #285 | Tragic 14.9% |
| Immigrants | Central America | 0.0 /100 | #286 | Tragic 15.0% |
| Immigrants | Guatemala | 0.0 /100 | #287 | Tragic 15.1% |