Chinese vs Immigrants from Costa Rica Single Mother Poverty
COMPARE
Chinese
Immigrants from Costa Rica
Single Mother Poverty
Single Mother Poverty Comparison
Chinese
Immigrants from Costa Rica
24.6%
SINGLE MOTHER POVERTY
100.0/ 100
METRIC RATING
7th/ 347
METRIC RANK
29.2%
SINGLE MOTHER POVERTY
48.8/ 100
METRIC RATING
175th/ 347
METRIC RANK
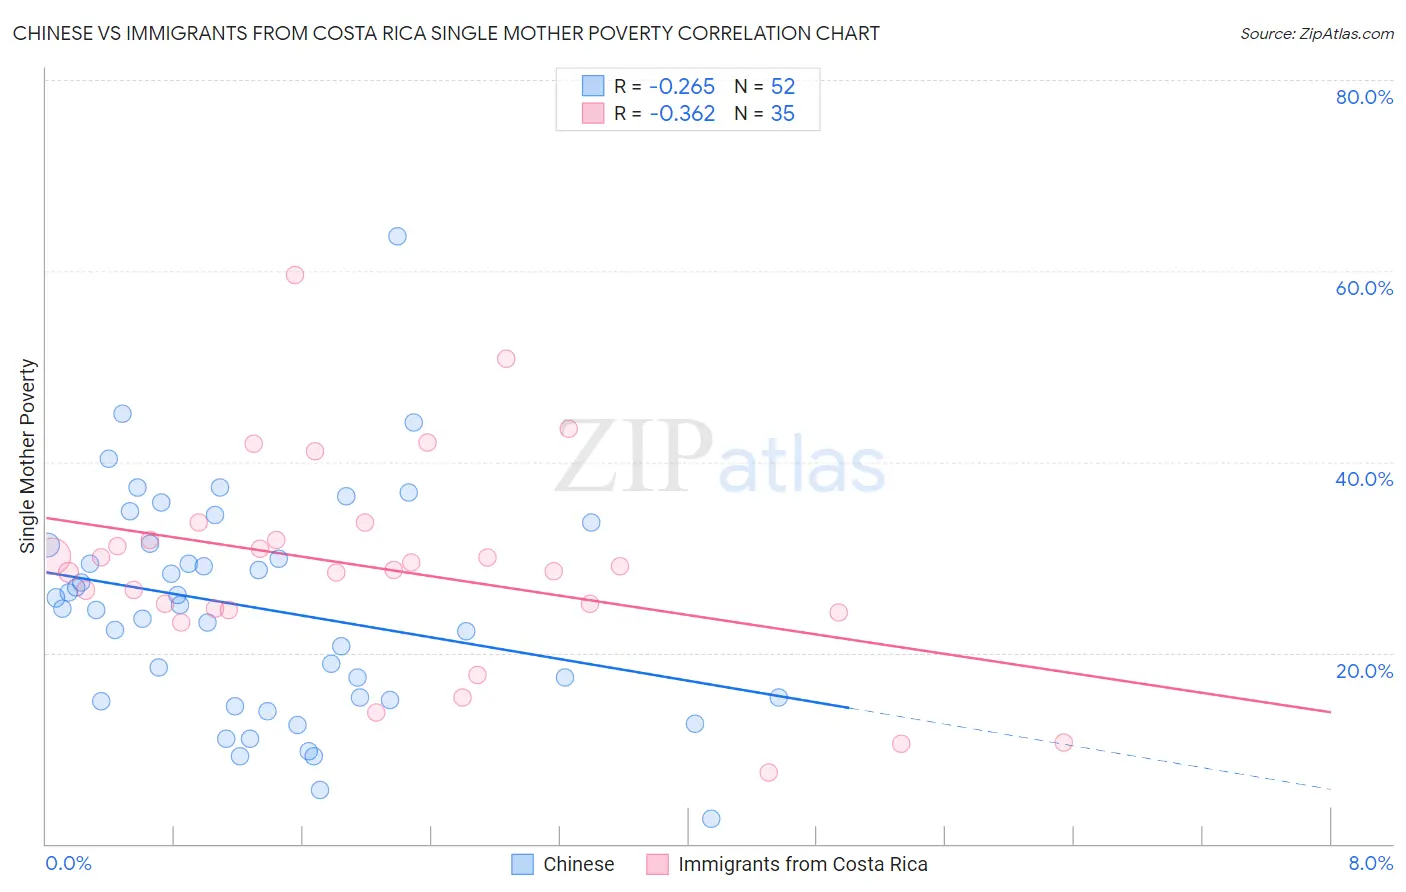
Chinese vs Immigrants from Costa Rica Single Mother Poverty Correlation Chart
The statistical analysis conducted on geographies consisting of 64,411,570 people shows a weak negative correlation between the proportion of Chinese and poverty level among single mothers in the United States with a correlation coefficient (R) of -0.265 and weighted average of 24.6%. Similarly, the statistical analysis conducted on geographies consisting of 201,853,428 people shows a mild negative correlation between the proportion of Immigrants from Costa Rica and poverty level among single mothers in the United States with a correlation coefficient (R) of -0.362 and weighted average of 29.2%, a difference of 18.5%.
Single Mother Poverty Correlation Summary
| Measurement | Chinese | Immigrants from Costa Rica |
| Minimum | 2.6% | 7.4% |
| Maximum | 63.6% | 59.6% |
| Range | 61.1% | 52.2% |
| Mean | 24.6% | 28.9% |
| Median | 24.8% | 28.6% |
| Interquartile 25% (IQ1) | 15.2% | 24.4% |
| Interquartile 75% (IQ3) | 31.4% | 31.9% |
| Interquartile Range (IQR) | 16.2% | 7.4% |
| Standard Deviation (Sample) | 11.6% | 10.9% |
| Standard Deviation (Population) | 11.4% | 10.7% |
Similar Demographics by Single Mother Poverty
Demographics Similar to Chinese by Single Mother Poverty
In terms of single mother poverty, the demographic groups most similar to Chinese are Thai (24.5%, a difference of 0.54%), Immigrants from Hong Kong (24.4%, a difference of 1.0%), Filipino (24.3%, a difference of 1.3%), Immigrants from Iran (25.1%, a difference of 2.0%), and Immigrants from Lithuania (25.2%, a difference of 2.4%).
| Demographics | Rating | Rank | Single Mother Poverty |
| Assyrians/Chaldeans/Syriacs | 100.0 /100 | #1 | Exceptional 23.8% |
| Immigrants | India | 100.0 /100 | #2 | Exceptional 23.8% |
| Immigrants | Taiwan | 100.0 /100 | #3 | Exceptional 23.9% |
| Filipinos | 100.0 /100 | #4 | Exceptional 24.3% |
| Immigrants | Hong Kong | 100.0 /100 | #5 | Exceptional 24.4% |
| Thais | 100.0 /100 | #6 | Exceptional 24.5% |
| Chinese | 100.0 /100 | #7 | Exceptional 24.6% |
| Immigrants | Iran | 100.0 /100 | #8 | Exceptional 25.1% |
| Immigrants | Lithuania | 100.0 /100 | #9 | Exceptional 25.2% |
| Immigrants | South Central Asia | 100.0 /100 | #10 | Exceptional 25.3% |
| Iranians | 100.0 /100 | #11 | Exceptional 25.5% |
| Bhutanese | 100.0 /100 | #12 | Exceptional 25.6% |
| Indians (Asian) | 100.0 /100 | #13 | Exceptional 25.8% |
| Immigrants | Singapore | 100.0 /100 | #14 | Exceptional 25.8% |
| Immigrants | Ireland | 100.0 /100 | #15 | Exceptional 25.8% |
Demographics Similar to Immigrants from Costa Rica by Single Mother Poverty
In terms of single mother poverty, the demographic groups most similar to Immigrants from Costa Rica are Hawaiian (29.2%, a difference of 0.040%), Immigrants from Saudi Arabia (29.2%, a difference of 0.060%), British (29.2%, a difference of 0.090%), Immigrants from Bosnia and Herzegovina (29.2%, a difference of 0.17%), and Carpatho Rusyn (29.1%, a difference of 0.24%).
| Demographics | Rating | Rank | Single Mother Poverty |
| Europeans | 57.6 /100 | #168 | Average 29.1% |
| Immigrants | Uruguay | 57.2 /100 | #169 | Average 29.1% |
| New Zealanders | 55.1 /100 | #170 | Average 29.1% |
| Puget Sound Salish | 55.1 /100 | #171 | Average 29.1% |
| Carpatho Rusyns | 53.8 /100 | #172 | Average 29.1% |
| British | 50.6 /100 | #173 | Average 29.2% |
| Immigrants | Saudi Arabia | 50.0 /100 | #174 | Average 29.2% |
| Immigrants | Costa Rica | 48.8 /100 | #175 | Average 29.2% |
| Hawaiians | 47.8 /100 | #176 | Average 29.2% |
| Immigrants | Bosnia and Herzegovina | 45.1 /100 | #177 | Average 29.2% |
| South American Indians | 43.2 /100 | #178 | Average 29.3% |
| Immigrants | Uzbekistan | 42.6 /100 | #179 | Average 29.3% |
| Immigrants | Norway | 41.5 /100 | #180 | Average 29.3% |
| Canadians | 40.4 /100 | #181 | Average 29.3% |
| Immigrants | Eastern Africa | 38.5 /100 | #182 | Fair 29.3% |