Chilean vs Greek Seniors Poverty Over the Age of 65

COMPARE

Chilean
Race
Ancestry
AfghanAfricanAlaska NativeAlaskan AthabascanAlbanianAleutAlsatianAmericanApacheArabArapahoArgentineanArmenianAssyrian/Chaldean/SyriacAustralianAustrianBahamianBangladeshiBarbadianBasqueBelgianBelizeanBermudanBhutaneseBlackfeetBolivianBrazilianBritishBritish West IndianBulgarianBurmeseCajunCambodianCanadianCape VerdeanCarpatho RusynCelticCentral AmericanCentral American IndianCherokeeCheyenneChickasawChileanChineseChippewaChoctawColombianColvilleComancheCosta RicanCreeCreekCroatianCrowCubanCypriotCzechCzechoslovakianDanishDelawareDominicanDutchDutch West IndianEastern EuropeanEcuadorianEgyptianEnglishEstonianEthiopianEuropeanFijianFilipinoFinnishFrenchFrench American IndianFrench CanadianGermanGerman RussianGhanaianGuamanian/ChamorroGuatemalanGuyaneseHaitianHmongHonduranHopiHoumaHungarianIcelanderIndian (Asian)IndonesianInupiatIranianIraqiIrishIroquoisIsraeliItalianJamaicanJapaneseJordanianKenyanKiowaKoreanLaotianLatvianLebaneseLiberianLithuanianLumbeeLuxembourgerMacedonianMalaysianMalteseMarshalleseMenomineeMexicanMexican American IndianMongolianMoroccanNative HawaiianNavajoNepaleseNew ZealanderNicaraguanNigerianNorthern EuropeanNorwegianOkinawanOsageOttawaPaiutePakistaniPalestinianPanamanianParaguayanPennsylvania GermanPeruvianPimaPolishPortuguesePotawatomiPuebloPuerto RicanPuget Sound SalishRomanianRussianSalvadoranSamoanScandinavianScotch-IrishScottishSeminoleSenegaleseSerbianShoshoneSierra LeoneanSiouxSlavicSlovakSloveneSomaliSouth AfricanSouth AmericanSouth American IndianSoviet UnionSpaniardSpanishSpanish AmericanSpanish American IndianSri LankanSubsaharan AfricanSudaneseSwedishSwissSyrianTaiwaneseThaiTlingit-HaidaTohono O'OdhamTonganTrinidadian and TobagonianTsimshianTurkishU.S. Virgin IslanderUgandanUkrainianUruguayanUteVenezuelanVietnameseWelshWest IndianYakamaYaquiYugoslavianYumanYup'ikZimbabwean
Immigration
NonimmigrantsImmigrantsAfghanistanAfricaAlbaniaArgentinaArmeniaAsiaAustraliaAustriaBahamasBangladeshBarbadosBelarusBelgiumBelizeBoliviaBosnia and HerzegovinaBrazilBulgariaBurma/MyanmarCabo VerdeCambodiaCameroonCanadaCaribbeanCentral AmericaChileChinaColombiaCongoCosta RicaCroatiaCubaCzechoslovakiaDenmarkDominicaDominican RepublicEastern AfricaEastern AsiaEastern EuropeEcuadorEgyptEl SalvadorEnglandEritreaEthiopiaEuropeFijiFranceGermanyGhanaGreeceGrenadaGuatemalaGuyanaHaitiHondurasHong KongHungaryIndiaIndonesiaIranIraqIrelandIsraelItalyJamaicaJapanJordanKazakhstanKenyaKoreaKuwaitLaosLatin AmericaLatviaLebanonLiberiaLithuaniaMalaysiaMexicoMicronesiaMiddle AfricaMoldovaMoroccoNepalNetherlandsNicaraguaNigeriaNorth AmericaNorth MacedoniaNorthern AfricaNorthern EuropeNorwayOceaniaPakistanPanamaPeruPhilippinesPolandPortugalRomaniaRussiaSaudi ArabiaScotlandSenegalSerbiaSierra LeoneSingaporeSomaliaSouth AfricaSouth AmericaSouth Central AsiaSouth Eastern AsiaSouthern EuropeSpainSri LankaSt. Vincent and the GrenadinesSudanSwedenSwitzerlandSyriaTaiwanThailandTrinidad and TobagoTurkeyUgandaUkraineUruguayUzbekistanVenezuelaVietnamWest IndiesWestern AfricaWestern AsiaWestern EuropeYemenZaireZimbabweAzores
Greek
Race
Ancestry
AfghanAfricanAlaska NativeAlaskan AthabascanAlbanianAleutAlsatianAmericanApacheArabArapahoArgentineanArmenianAssyrian/Chaldean/SyriacAustralianAustrianBahamianBangladeshiBarbadianBasqueBelgianBelizeanBermudanBhutaneseBlackfeetBolivianBrazilianBritishBritish West IndianBulgarianBurmeseCajunCambodianCanadianCape VerdeanCarpatho RusynCelticCentral AmericanCentral American IndianCherokeeCheyenneChickasawChineseChippewaChoctawColombianColvilleComancheCosta RicanCreeCreekCroatianCrowCubanCypriotCzechCzechoslovakianDanishDelawareDominicanDutchDutch West IndianEastern EuropeanEcuadorianEgyptianEnglishEstonianEthiopianEuropeanFijianFilipinoFinnishFrenchFrench American IndianFrench CanadianGermanGerman RussianGhanaianGreekGuamanian/ChamorroGuatemalanGuyaneseHaitianHmongHonduranHopiHoumaHungarianIcelanderIndian (Asian)IndonesianInupiatIranianIraqiIrishIroquoisIsraeliItalianJamaicanJapaneseJordanianKenyanKiowaKoreanLaotianLatvianLebaneseLiberianLithuanianLumbeeLuxembourgerMacedonianMalaysianMalteseMarshalleseMenomineeMexicanMexican American IndianMongolianMoroccanNative HawaiianNavajoNepaleseNew ZealanderNicaraguanNigerianNorthern EuropeanNorwegianOkinawanOsageOttawaPaiutePakistaniPalestinianPanamanianParaguayanPennsylvania GermanPeruvianPimaPolishPortuguesePotawatomiPuebloPuerto RicanPuget Sound SalishRomanianRussianSalvadoranSamoanScandinavianScotch-IrishScottishSeminoleSenegaleseSerbianShoshoneSierra LeoneanSiouxSlavicSlovakSloveneSomaliSouth AfricanSouth AmericanSouth American IndianSoviet UnionSpaniardSpanishSpanish AmericanSpanish American IndianSri LankanSubsaharan AfricanSudaneseSwedishSwissSyrianTaiwaneseThaiTlingit-HaidaTohono O'OdhamTonganTrinidadian and TobagonianTsimshianTurkishU.S. Virgin IslanderUgandanUkrainianUruguayanUteVenezuelanVietnameseWelshWest IndianYakamaYaquiYugoslavianYumanYup'ikZimbabwean
Immigration
NonimmigrantsImmigrantsAfghanistanAfricaAlbaniaArgentinaArmeniaAsiaAustraliaAustriaBahamasBangladeshBarbadosBelarusBelgiumBelizeBoliviaBosnia and HerzegovinaBrazilBulgariaBurma/MyanmarCabo VerdeCambodiaCameroonCanadaCaribbeanCentral AmericaChileChinaColombiaCongoCosta RicaCroatiaCubaCzechoslovakiaDenmarkDominicaDominican RepublicEastern AfricaEastern AsiaEastern EuropeEcuadorEgyptEl SalvadorEnglandEritreaEthiopiaEuropeFijiFranceGermanyGhanaGreeceGrenadaGuatemalaGuyanaHaitiHondurasHong KongHungaryIndiaIndonesiaIranIraqIrelandIsraelItalyJamaicaJapanJordanKazakhstanKenyaKoreaKuwaitLaosLatin AmericaLatviaLebanonLiberiaLithuaniaMalaysiaMexicoMicronesiaMiddle AfricaMoldovaMoroccoNepalNetherlandsNicaraguaNigeriaNorth AmericaNorth MacedoniaNorthern AfricaNorthern EuropeNorwayOceaniaPakistanPanamaPeruPhilippinesPolandPortugalRomaniaRussiaSaudi ArabiaScotlandSenegalSerbiaSierra LeoneSingaporeSomaliaSouth AfricaSouth AmericaSouth Central AsiaSouth Eastern AsiaSouthern EuropeSpainSri LankaSt. Vincent and the GrenadinesSudanSwedenSwitzerlandSyriaTaiwanThailandTrinidad and TobagoTurkeyUgandaUkraineUruguayUzbekistanVenezuelaVietnamWest IndiesWestern AfricaWestern AsiaWestern EuropeYemenZaireZimbabweAzores
Seniors Poverty Over the Age of 65
Income
Poverty
Unemployment
Labor Participation
Family Structure
Vehicle Availability
Education Level
Disability

Seniors Poverty Over the Age of 65 Comparison

Chileans

Greeks

Fair
Exceptional
11.2%
SENIORS POVERTY OVER THE AGE OF 65
27.8/ 100
METRIC RATING
194th/ 347
METRIC RANK
9.6%
SENIORS POVERTY OVER THE AGE OF 65
99.6/ 100
METRIC RATING
39th/ 347
METRIC RANK

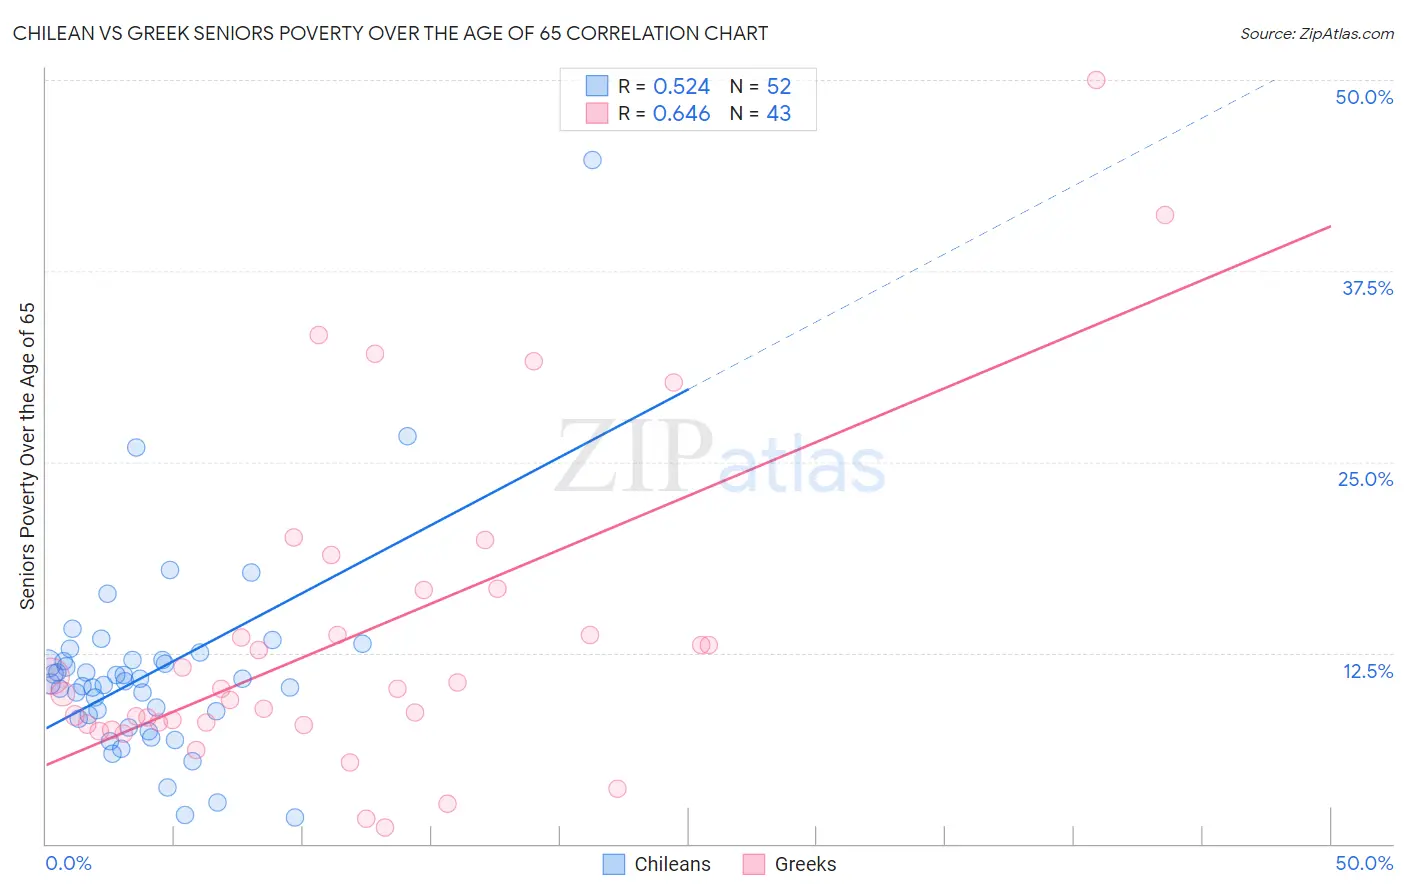
Chilean vs Greek Seniors Poverty Over the Age of 65 Correlation Chart

The statistical analysis conducted on geographies consisting of 256,180,753 people shows a substantial positive correlation between the proportion of Chileans and poverty level among seniors over the age of 65 in the United States with a correlation coefficient (R) of 0.524 and weighted average of 11.2%. Similarly, the statistical analysis conducted on geographies consisting of 480,237,889 people shows a significant positive correlation between the proportion of Greeks and poverty level among seniors over the age of 65 in the United States with a correlation coefficient (R) of 0.646 and weighted average of 9.6%, a difference of 16.7%.
Chilean vs Greek Seniors Poverty Over the Age of 65

Seniors Poverty Over the Age of 65 Correlation Summary

MeasurementChileanGreek
Minimum1.7%1.0%
Maximum44.7%50.0%
Range43.0%49.0%
Mean11.2%13.7%
Median10.5%10.1%
Interquartile 25% (IQ1)8.3%7.8%
Interquartile 75% (IQ3)12.0%16.6%
Interquartile Range (IQR)3.7%8.8%
Standard Deviation (Sample)6.6%10.6%
Standard Deviation (Population)6.6%10.4%

Similar Demographics by Seniors Poverty Over the Age of 65

Demographics Similar to Chileans by Seniors Poverty Over the Age of 65

In terms of seniors poverty over the age of 65, the demographic groups most similar to Chileans are Immigrants from Vietnam (11.2%, a difference of 0.13%), Taiwanese (11.2%, a difference of 0.15%), Immigrants from Southern Europe (11.1%, a difference of 0.24%), Bangladeshi (11.2%, a difference of 0.30%), and Albanian (11.2%, a difference of 0.39%).
DemographicsRating | RankSeniors Poverty Over the Age of 65
Immigrants | Middle Africa
37.4
/100
|
#187
Fair
11.1%
Immigrants | Hong Kong
36.3
/100
|
#188
Fair
11.1%
Immigrants | Laos
35.7
/100
|
#189
Fair
11.1%
Indians (Asian)
34.2
/100
|
#190
Fair
11.1%
Immigrants | Uganda
32.2
/100
|
#191
Fair
11.1%
Immigrants | Southern Europe
30.1
/100
|
#192
Fair
11.1%
Taiwanese
29.2
/100
|
#193
Fair
11.2%
Chileans
27.8
/100
|
#194
Fair
11.2%
Immigrants | Vietnam
26.6
/100
|
#195
Fair
11.2%
Bangladeshis
25.2
/100
|
#196
Fair
11.2%
Albanians
24.4
/100
|
#197
Fair
11.2%
Immigrants | Burma/Myanmar
21.3
/100
|
#198
Fair
11.3%
Immigrants | Israel
20.3
/100
|
#199
Fair
11.3%
Alsatians
20.1
/100
|
#200
Fair
11.3%
Immigrants | Brazil
17.8
/100
|
#201
Poor
11.3%

Demographics Similar to Greeks by Seniors Poverty Over the Age of 65

In terms of seniors poverty over the age of 65, the demographic groups most similar to Greeks are Assyrian/Chaldean/Syriac (9.6%, a difference of 0.12%), Immigrants from North Macedonia (9.6%, a difference of 0.28%), Zimbabwean (9.6%, a difference of 0.44%), Eastern European (9.6%, a difference of 0.54%), and Belgian (9.5%, a difference of 0.63%).
DemographicsRating | RankSeniors Poverty Over the Age of 65
Northern Europeans
99.8
/100
|
#32
Exceptional
9.4%
Native Hawaiians
99.8
/100
|
#33
Exceptional
9.4%
British
99.8
/100
|
#34
Exceptional
9.4%
Latvians
99.8
/100
|
#35
Exceptional
9.5%
Czechoslovakians
99.8
/100
|
#36
Exceptional
9.5%
Scotch-Irish
99.7
/100
|
#37
Exceptional
9.5%
Belgians
99.7
/100
|
#38
Exceptional
9.5%
Greeks
99.6
/100
|
#39
Exceptional
9.6%
Assyrians/Chaldeans/Syriacs
99.6
/100
|
#40
Exceptional
9.6%
Immigrants | North Macedonia
99.6
/100
|
#41
Exceptional
9.6%
Zimbabweans
99.6
/100
|
#42
Exceptional
9.6%
Eastern Europeans
99.6
/100
|
#43
Exceptional
9.6%
Austrians
99.5
/100
|
#44
Exceptional
9.6%
Estonians
99.5
/100
|
#45
Exceptional
9.6%
Immigrants | Taiwan
99.5
/100
|
#46
Exceptional
9.7%