Cheyenne vs Soviet Union Child Poverty Among Girls Under 16
COMPARE
Cheyenne
Soviet Union
Child Poverty Among Girls Under 16
Child Poverty Among Girls Under 16 Comparison
Cheyenne
Soviet Union
26.3%
CHILD POVERTY AMONG GIRLS UNDER 16
0.0/ 100
METRIC RATING
338th/ 347
METRIC RANK
14.8%
CHILD POVERTY AMONG GIRLS UNDER 16
97.3/ 100
METRIC RATING
84th/ 347
METRIC RANK
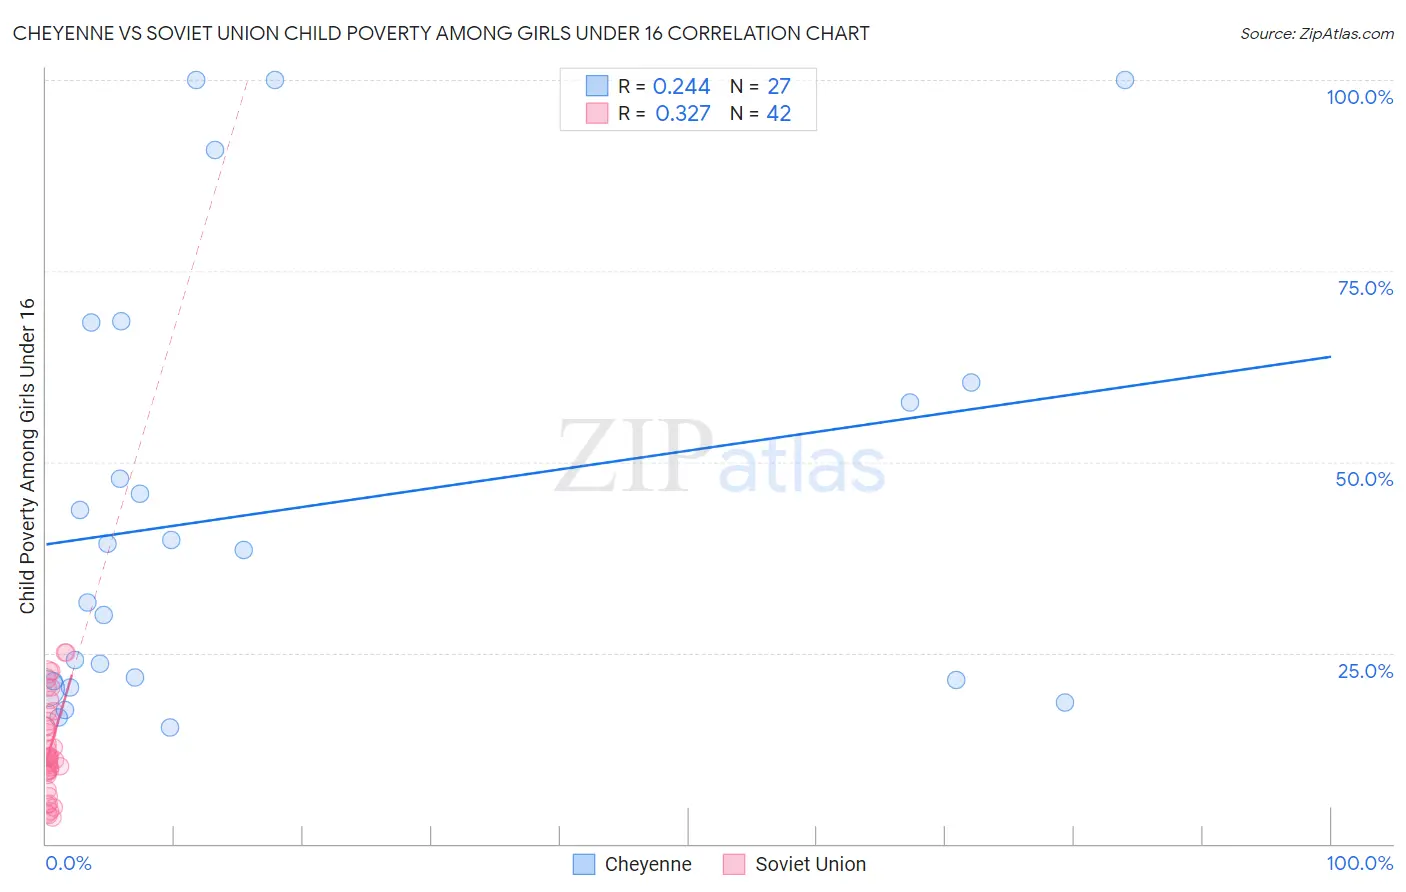
Cheyenne vs Soviet Union Child Poverty Among Girls Under 16 Correlation Chart
The statistical analysis conducted on geographies consisting of 80,342,731 people shows a weak positive correlation between the proportion of Cheyenne and poverty level among girls under the age of 16 in the United States with a correlation coefficient (R) of 0.244 and weighted average of 26.3%. Similarly, the statistical analysis conducted on geographies consisting of 43,333,279 people shows a mild positive correlation between the proportion of Soviet Union and poverty level among girls under the age of 16 in the United States with a correlation coefficient (R) of 0.327 and weighted average of 14.8%, a difference of 77.9%.
Child Poverty Among Girls Under 16 Correlation Summary
| Measurement | Cheyenne | Soviet Union |
| Minimum | 15.2% | 3.5% |
| Maximum | 100.0% | 25.0% |
| Range | 84.8% | 21.5% |
| Mean | 43.8% | 12.4% |
| Median | 38.5% | 11.2% |
| Interquartile 25% (IQ1) | 21.3% | 9.3% |
| Interquartile 75% (IQ3) | 60.4% | 16.0% |
| Interquartile Range (IQR) | 39.1% | 6.7% |
| Standard Deviation (Sample) | 27.8% | 6.0% |
| Standard Deviation (Population) | 27.3% | 5.9% |
Similar Demographics by Child Poverty Among Girls Under 16
Demographics Similar to Cheyenne by Child Poverty Among Girls Under 16
In terms of child poverty among girls under 16, the demographic groups most similar to Cheyenne are Crow (26.4%, a difference of 0.34%), Yup'ik (25.8%, a difference of 1.8%), Sioux (25.6%, a difference of 2.7%), Yuman (27.1%, a difference of 3.1%), and Pueblo (25.2%, a difference of 4.3%).
| Demographics | Rating | Rank | Child Poverty Among Girls Under 16 |
| Apache | 0.0 /100 | #331 | Tragic 23.8% |
| Natives/Alaskans | 0.0 /100 | #332 | Tragic 24.0% |
| Blacks/African Americans | 0.0 /100 | #333 | Tragic 24.7% |
| Menominee | 0.0 /100 | #334 | Tragic 25.0% |
| Pueblo | 0.0 /100 | #335 | Tragic 25.2% |
| Sioux | 0.0 /100 | #336 | Tragic 25.6% |
| Yup'ik | 0.0 /100 | #337 | Tragic 25.8% |
| Cheyenne | 0.0 /100 | #338 | Tragic 26.3% |
| Crow | 0.0 /100 | #339 | Tragic 26.4% |
| Yuman | 0.0 /100 | #340 | Tragic 27.1% |
| Hopi | 0.0 /100 | #341 | Tragic 27.9% |
| Pima | 0.0 /100 | #342 | Tragic 28.2% |
| Immigrants | Yemen | 0.0 /100 | #343 | Tragic 29.5% |
| Navajo | 0.0 /100 | #344 | Tragic 30.5% |
| Lumbee | 0.0 /100 | #345 | Tragic 30.7% |
Demographics Similar to Soviet Union by Child Poverty Among Girls Under 16
In terms of child poverty among girls under 16, the demographic groups most similar to Soviet Union are Immigrants from Italy (14.8%, a difference of 0.070%), Swiss (14.8%, a difference of 0.11%), Australian (14.8%, a difference of 0.15%), Finnish (14.8%, a difference of 0.18%), and Immigrants from Canada (14.8%, a difference of 0.24%).
| Demographics | Rating | Rank | Child Poverty Among Girls Under 16 |
| Tlingit-Haida | 97.9 /100 | #77 | Exceptional 14.7% |
| Argentineans | 97.9 /100 | #78 | Exceptional 14.7% |
| Immigrants | Turkey | 97.9 /100 | #79 | Exceptional 14.7% |
| Egyptians | 97.9 /100 | #80 | Exceptional 14.7% |
| Ukrainians | 97.7 /100 | #81 | Exceptional 14.7% |
| Macedonians | 97.6 /100 | #82 | Exceptional 14.7% |
| Immigrants | Italy | 97.4 /100 | #83 | Exceptional 14.8% |
| Soviet Union | 97.3 /100 | #84 | Exceptional 14.8% |
| Swiss | 97.2 /100 | #85 | Exceptional 14.8% |
| Australians | 97.2 /100 | #86 | Exceptional 14.8% |
| Finns | 97.2 /100 | #87 | Exceptional 14.8% |
| Immigrants | Canada | 97.1 /100 | #88 | Exceptional 14.8% |
| Jordanians | 97.1 /100 | #89 | Exceptional 14.8% |
| Northern Europeans | 97.0 /100 | #90 | Exceptional 14.8% |
| Immigrants | Belarus | 97.0 /100 | #91 | Exceptional 14.8% |