Cheyenne vs Potawatomi Child Poverty Among Boys Under 16
COMPARE
Cheyenne
Potawatomi
Child Poverty Among Boys Under 16
Child Poverty Among Boys Under 16 Comparison
Cheyenne
Potawatomi
25.8%
CHILD POVERTY AMONG BOYS UNDER 16
0.0/ 100
METRIC RATING
337th/ 347
METRIC RANK
19.4%
CHILD POVERTY AMONG BOYS UNDER 16
0.2/ 100
METRIC RATING
258th/ 347
METRIC RANK
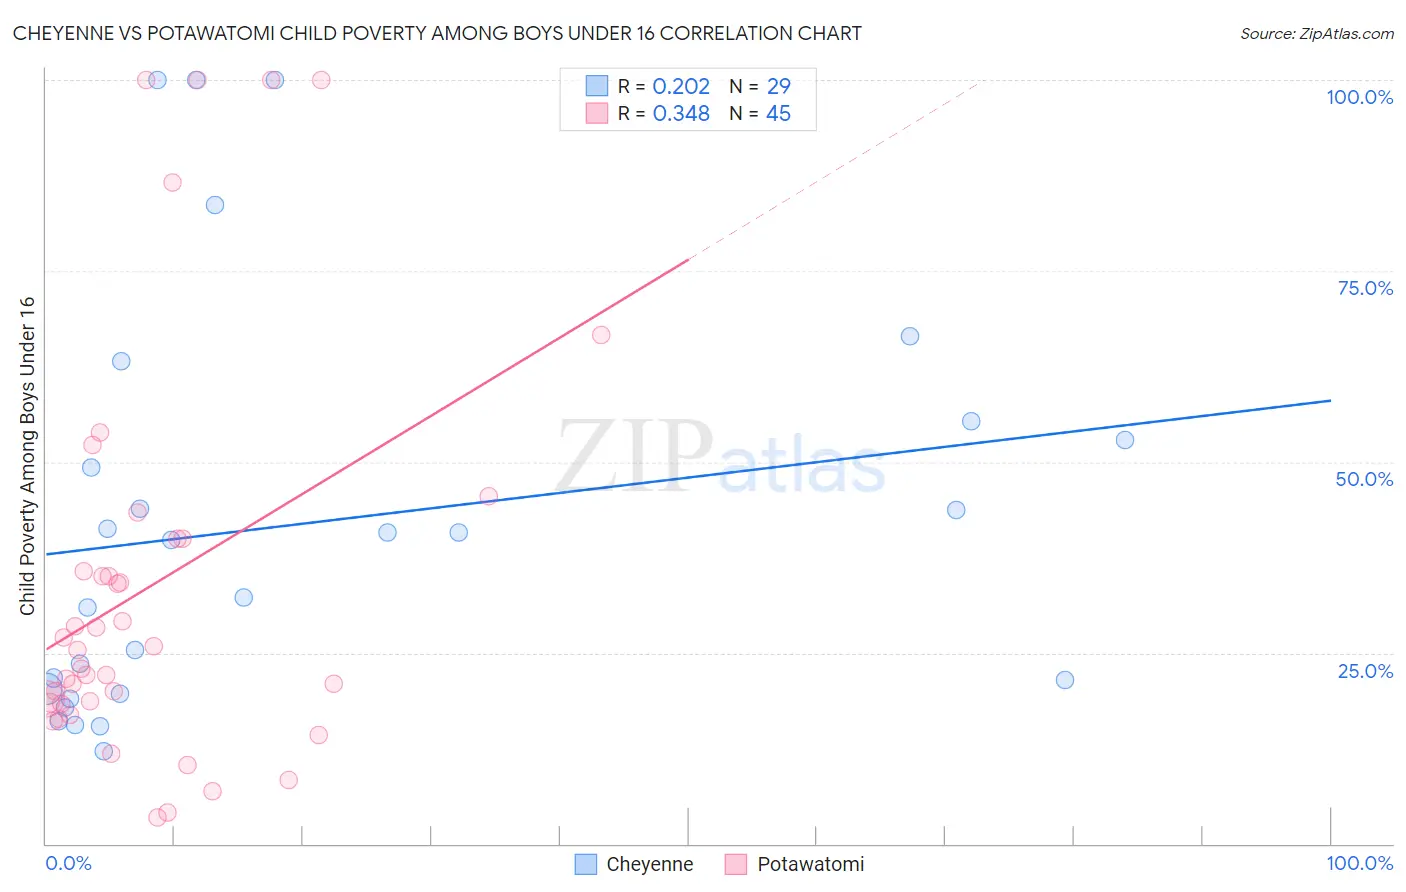
Cheyenne vs Potawatomi Child Poverty Among Boys Under 16 Correlation Chart
The statistical analysis conducted on geographies consisting of 80,373,873 people shows a weak positive correlation between the proportion of Cheyenne and poverty level among boys under the age of 16 in the United States with a correlation coefficient (R) of 0.202 and weighted average of 25.8%. Similarly, the statistical analysis conducted on geographies consisting of 117,214,140 people shows a mild positive correlation between the proportion of Potawatomi and poverty level among boys under the age of 16 in the United States with a correlation coefficient (R) of 0.348 and weighted average of 19.4%, a difference of 33.2%.
Child Poverty Among Boys Under 16 Correlation Summary
| Measurement | Cheyenne | Potawatomi |
| Minimum | 12.2% | 3.5% |
| Maximum | 100.0% | 100.0% |
| Range | 87.8% | 96.5% |
| Mean | 41.8% | 33.8% |
| Median | 39.8% | 25.4% |
| Interquartile 25% (IQ1) | 20.0% | 18.4% |
| Interquartile 75% (IQ3) | 54.1% | 40.0% |
| Interquartile Range (IQR) | 34.1% | 21.6% |
| Standard Deviation (Sample) | 26.7% | 26.3% |
| Standard Deviation (Population) | 26.2% | 26.0% |
Similar Demographics by Child Poverty Among Boys Under 16
Demographics Similar to Cheyenne by Child Poverty Among Boys Under 16
In terms of child poverty among boys under 16, the demographic groups most similar to Cheyenne are Hopi (25.9%, a difference of 0.51%), Houma (26.2%, a difference of 1.5%), Crow (26.3%, a difference of 1.7%), Sioux (25.3%, a difference of 2.0%), and Yup'ik (24.7%, a difference of 4.4%).
| Demographics | Rating | Rank | Child Poverty Among Boys Under 16 |
| Colville | 0.0 /100 | #330 | Tragic 24.1% |
| Dominicans | 0.0 /100 | #331 | Tragic 24.2% |
| Immigrants | Dominican Republic | 0.0 /100 | #332 | Tragic 24.3% |
| Apache | 0.0 /100 | #333 | Tragic 24.5% |
| Blacks/African Americans | 0.0 /100 | #334 | Tragic 24.5% |
| Yup'ik | 0.0 /100 | #335 | Tragic 24.7% |
| Sioux | 0.0 /100 | #336 | Tragic 25.3% |
| Cheyenne | 0.0 /100 | #337 | Tragic 25.8% |
| Hopi | 0.0 /100 | #338 | Tragic 25.9% |
| Houma | 0.0 /100 | #339 | Tragic 26.2% |
| Crow | 0.0 /100 | #340 | Tragic 26.3% |
| Immigrants | Yemen | 0.0 /100 | #341 | Tragic 28.9% |
| Pima | 0.0 /100 | #342 | Tragic 29.7% |
| Navajo | 0.0 /100 | #343 | Tragic 30.3% |
| Yuman | 0.0 /100 | #344 | Tragic 30.6% |
Demographics Similar to Potawatomi by Child Poverty Among Boys Under 16
In terms of child poverty among boys under 16, the demographic groups most similar to Potawatomi are Mexican American Indian (19.4%, a difference of 0.020%), Spanish American (19.4%, a difference of 0.020%), Shoshone (19.4%, a difference of 0.12%), Immigrants from Ghana (19.4%, a difference of 0.13%), and Immigrants from Liberia (19.3%, a difference of 0.22%).
| Demographics | Rating | Rank | Child Poverty Among Boys Under 16 |
| French American Indians | 0.2 /100 | #251 | Tragic 19.2% |
| Immigrants | Western Africa | 0.2 /100 | #252 | Tragic 19.3% |
| Liberians | 0.2 /100 | #253 | Tragic 19.3% |
| Trinidadians and Tobagonians | 0.2 /100 | #254 | Tragic 19.3% |
| Ecuadorians | 0.2 /100 | #255 | Tragic 19.3% |
| Immigrants | Liberia | 0.2 /100 | #256 | Tragic 19.3% |
| Mexican American Indians | 0.2 /100 | #257 | Tragic 19.4% |
| Potawatomi | 0.2 /100 | #258 | Tragic 19.4% |
| Spanish Americans | 0.2 /100 | #259 | Tragic 19.4% |
| Shoshone | 0.2 /100 | #260 | Tragic 19.4% |
| Immigrants | Ghana | 0.2 /100 | #261 | Tragic 19.4% |
| Immigrants | Guyana | 0.1 /100 | #262 | Tragic 19.5% |
| Ottawa | 0.1 /100 | #263 | Tragic 19.5% |
| Iroquois | 0.1 /100 | #264 | Tragic 19.6% |
| Guyanese | 0.1 /100 | #265 | Tragic 19.6% |