Cherokee vs Immigrants from Morocco Family Poverty

COMPARE

Cherokee
Race
Ancestry
AfghanAfricanAlaska NativeAlaskan AthabascanAlbanianAleutAlsatianAmericanApacheArabArapahoArgentineanArmenianAssyrian/Chaldean/SyriacAustralianAustrianBahamianBangladeshiBarbadianBasqueBelgianBelizeanBermudanBhutaneseBlackfeetBolivianBrazilianBritishBritish West IndianBulgarianBurmeseCajunCambodianCanadianCape VerdeanCarpatho RusynCelticCentral AmericanCentral American IndianCherokeeCheyenneChickasawChileanChineseChippewaChoctawColombianColvilleComancheCosta RicanCreeCreekCroatianCrowCubanCypriotCzechCzechoslovakianDanishDelawareDominicanDutchDutch West IndianEastern EuropeanEcuadorianEgyptianEnglishEstonianEthiopianEuropeanFijianFilipinoFinnishFrenchFrench American IndianFrench CanadianGermanGerman RussianGhanaianGreekGuamanian/ChamorroGuatemalanGuyaneseHaitianHmongHonduranHopiHoumaHungarianIcelanderIndian (Asian)IndonesianInupiatIranianIraqiIrishIroquoisIsraeliItalianJamaicanJapaneseJordanianKenyanKiowaKoreanLaotianLatvianLebaneseLiberianLithuanianLumbeeLuxembourgerMacedonianMalaysianMalteseMarshalleseMenomineeMexicanMexican American IndianMongolianMoroccanNative HawaiianNavajoNepaleseNew ZealanderNicaraguanNigerianNorthern EuropeanNorwegianOkinawanOsageOttawaPaiutePakistaniPalestinianPanamanianParaguayanPennsylvania GermanPeruvianPimaPolishPortuguesePotawatomiPuebloPuerto RicanPuget Sound SalishRomanianRussianSalvadoranSamoanScandinavianScotch-IrishScottishSeminoleSenegaleseSerbianShoshoneSierra LeoneanSiouxSlavicSlovakSloveneSomaliSouth AfricanSouth AmericanSouth American IndianSoviet UnionSpaniardSpanishSpanish AmericanSpanish American IndianSri LankanSubsaharan AfricanSudaneseSwedishSwissSyrianTaiwaneseThaiTlingit-HaidaTohono O'OdhamTonganTrinidadian and TobagonianTsimshianTurkishU.S. Virgin IslanderUgandanUkrainianUruguayanUteVenezuelanVietnameseWelshWest IndianYakamaYaquiYugoslavianYumanYup'ikZimbabwean
Immigration
NonimmigrantsImmigrantsAfghanistanAfricaAlbaniaArgentinaArmeniaAsiaAustraliaAustriaBahamasBangladeshBarbadosBelarusBelgiumBelizeBoliviaBosnia and HerzegovinaBrazilBulgariaBurma/MyanmarCabo VerdeCambodiaCameroonCanadaCaribbeanCentral AmericaChileChinaColombiaCongoCosta RicaCroatiaCubaCzechoslovakiaDenmarkDominicaDominican RepublicEastern AfricaEastern AsiaEastern EuropeEcuadorEgyptEl SalvadorEnglandEritreaEthiopiaEuropeFijiFranceGermanyGhanaGreeceGrenadaGuatemalaGuyanaHaitiHondurasHong KongHungaryIndiaIndonesiaIranIraqIrelandIsraelItalyJamaicaJapanJordanKazakhstanKenyaKoreaKuwaitLaosLatin AmericaLatviaLebanonLiberiaLithuaniaMalaysiaMexicoMicronesiaMiddle AfricaMoldovaNepalNetherlandsNicaraguaNigeriaNorth AmericaNorth MacedoniaNorthern AfricaNorthern EuropeNorwayOceaniaPakistanPanamaPeruPhilippinesPolandPortugalRomaniaRussiaSaudi ArabiaScotlandSenegalSerbiaSierra LeoneSingaporeSomaliaSouth AfricaSouth AmericaSouth Central AsiaSouth Eastern AsiaSouthern EuropeSpainSri LankaSt. Vincent and the GrenadinesSudanSwedenSwitzerlandSyriaTaiwanThailandTrinidad and TobagoTurkeyUgandaUkraineUruguayUzbekistanVenezuelaVietnamWest IndiesWestern AfricaWestern AsiaWestern EuropeYemenZaireZimbabweAzores
Immigrants from Morocco
Race
Ancestry
AfghanAfricanAlaska NativeAlaskan AthabascanAlbanianAleutAlsatianAmericanApacheArabArapahoArgentineanArmenianAssyrian/Chaldean/SyriacAustralianAustrianBahamianBangladeshiBarbadianBasqueBelgianBelizeanBermudanBhutaneseBlackfeetBolivianBrazilianBritishBritish West IndianBulgarianBurmeseCajunCambodianCanadianCape VerdeanCarpatho RusynCelticCentral AmericanCentral American IndianCheyenneChickasawChileanChineseChippewaChoctawColombianColvilleComancheCosta RicanCreeCreekCroatianCrowCubanCypriotCzechCzechoslovakianDanishDelawareDominicanDutchDutch West IndianEastern EuropeanEcuadorianEgyptianEnglishEstonianEthiopianEuropeanFijianFilipinoFinnishFrenchFrench American IndianFrench CanadianGermanGerman RussianGhanaianGreekGuamanian/ChamorroGuatemalanGuyaneseHaitianHmongHonduranHopiHoumaHungarianIcelanderIndian (Asian)IndonesianInupiatIranianIraqiIrishIroquoisIsraeliItalianJamaicanJapaneseJordanianKenyanKiowaKoreanLaotianLatvianLebaneseLiberianLithuanianLumbeeLuxembourgerMacedonianMalaysianMalteseMarshalleseMenomineeMexicanMexican American IndianMongolianMoroccanNative HawaiianNavajoNepaleseNew ZealanderNicaraguanNigerianNorthern EuropeanNorwegianOkinawanOsageOttawaPaiutePakistaniPalestinianPanamanianParaguayanPennsylvania GermanPeruvianPimaPolishPortuguesePotawatomiPuebloPuerto RicanPuget Sound SalishRomanianRussianSalvadoranSamoanScandinavianScotch-IrishScottishSeminoleSenegaleseSerbianShoshoneSierra LeoneanSiouxSlavicSlovakSloveneSomaliSouth AfricanSouth AmericanSouth American IndianSoviet UnionSpaniardSpanishSpanish AmericanSpanish American IndianSri LankanSubsaharan AfricanSudaneseSwedishSwissSyrianTaiwaneseThaiTlingit-HaidaTohono O'OdhamTonganTrinidadian and TobagonianTsimshianTurkishU.S. Virgin IslanderUgandanUkrainianUruguayanUteVenezuelanVietnameseWelshWest IndianYakamaYaquiYugoslavianYumanYup'ikZimbabwean
Immigration
NonimmigrantsImmigrantsAfghanistanAfricaAlbaniaArgentinaArmeniaAsiaAustraliaAustriaBahamasBangladeshBarbadosBelarusBelgiumBelizeBoliviaBosnia and HerzegovinaBrazilBulgariaBurma/MyanmarCabo VerdeCambodiaCameroonCanadaCaribbeanCentral AmericaChileChinaColombiaCongoCosta RicaCroatiaCubaCzechoslovakiaDenmarkDominicaDominican RepublicEastern AfricaEastern AsiaEastern EuropeEcuadorEgyptEl SalvadorEnglandEritreaEthiopiaEuropeFijiFranceGermanyGhanaGreeceGrenadaGuatemalaGuyanaHaitiHondurasHong KongHungaryIndiaIndonesiaIranIraqIrelandIsraelItalyJamaicaJapanJordanKazakhstanKenyaKoreaKuwaitLaosLatin AmericaLatviaLebanonLiberiaLithuaniaMalaysiaMexicoMicronesiaMiddle AfricaMoldovaMoroccoNepalNetherlandsNicaraguaNigeriaNorth AmericaNorth MacedoniaNorthern AfricaNorthern EuropeNorwayOceaniaPakistanPanamaPeruPhilippinesPolandPortugalRomaniaRussiaSaudi ArabiaScotlandSenegalSerbiaSierra LeoneSingaporeSomaliaSouth AfricaSouth AmericaSouth Central AsiaSouth Eastern AsiaSouthern EuropeSpainSri LankaSt. Vincent and the GrenadinesSudanSwedenSwitzerlandSyriaTaiwanThailandTrinidad and TobagoTurkeyUgandaUkraineUruguayUzbekistanVenezuelaVietnamWest IndiesWestern AfricaWestern AsiaWestern EuropeYemenZaireZimbabweAzores
Family Poverty
Income
Poverty
Unemployment
Labor Participation
Family Structure
Vehicle Availability
Education Level
Disability

Family Poverty Comparison

Cherokee

Immigrants from Morocco

Tragic
Average
10.6%
FAMILY POVERTY
0.5/ 100
METRIC RATING
246th/ 347
METRIC RANK
9.1%
FAMILY POVERTY
40.2/ 100
METRIC RATING
182nd/ 347
METRIC RANK

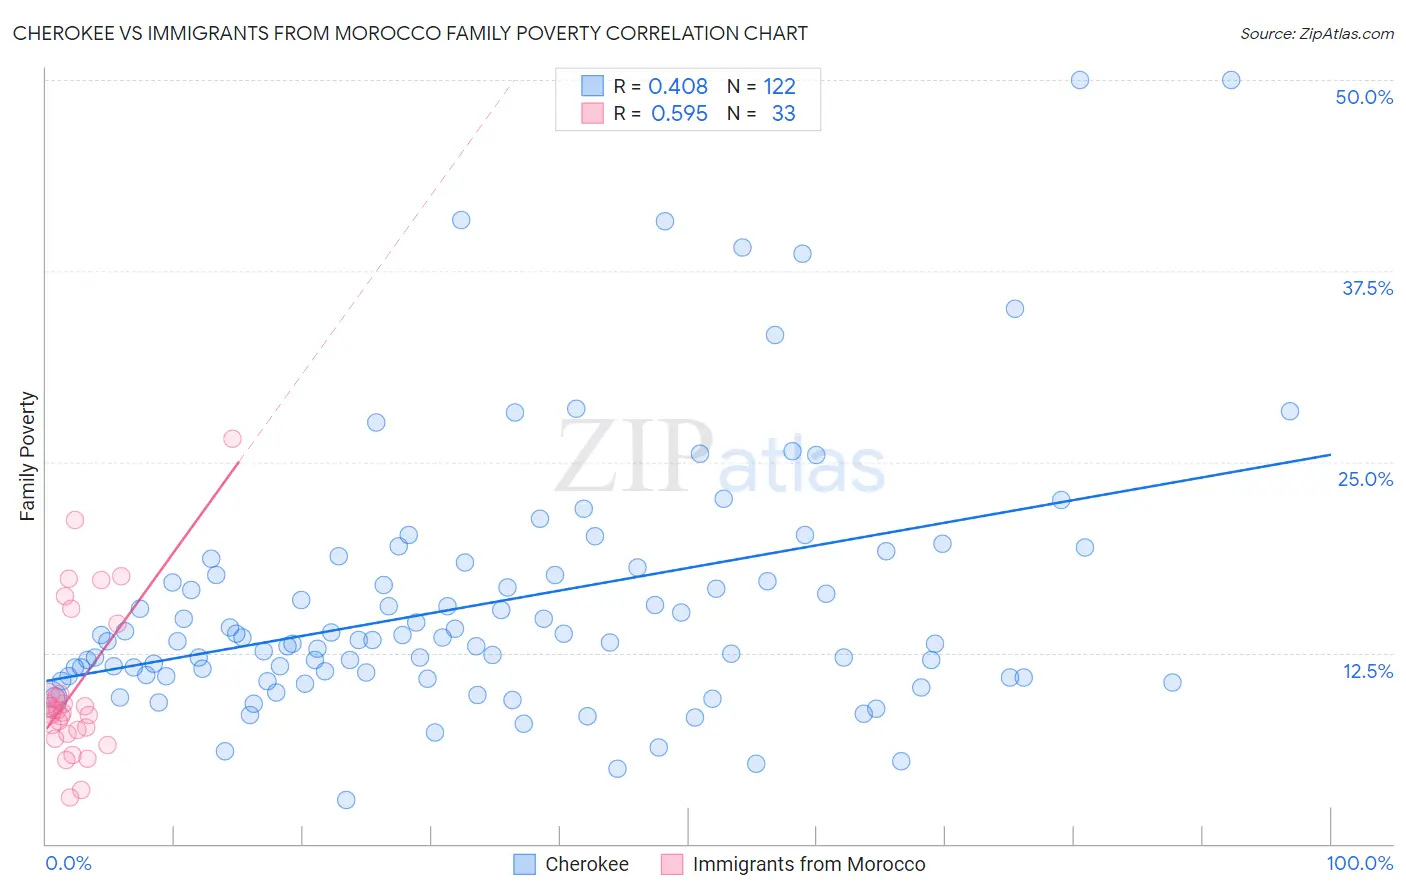
Cherokee vs Immigrants from Morocco Family Poverty Correlation Chart

The statistical analysis conducted on geographies consisting of 492,113,161 people shows a moderate positive correlation between the proportion of Cherokee and poverty level among families in the United States with a correlation coefficient (R) of 0.408 and weighted average of 10.6%. Similarly, the statistical analysis conducted on geographies consisting of 178,782,527 people shows a substantial positive correlation between the proportion of Immigrants from Morocco and poverty level among families in the United States with a correlation coefficient (R) of 0.595 and weighted average of 9.1%, a difference of 16.2%.
Cherokee vs Immigrants from Morocco Family Poverty

Family Poverty Correlation Summary

MeasurementCherokeeImmigrants from Morocco
Minimum2.9%3.0%
Maximum50.0%26.5%
Range47.1%23.5%
Mean15.7%10.2%
Median13.3%8.7%
Interquartile 25% (IQ1)10.9%7.3%
Interquartile 75% (IQ3)17.6%12.1%
Interquartile Range (IQR)6.7%4.8%
Standard Deviation (Sample)8.5%5.2%
Standard Deviation (Population)8.4%5.1%

Similar Demographics by Family Poverty

Demographics Similar to Cherokee by Family Poverty

In terms of family poverty, the demographic groups most similar to Cherokee are Liberian (10.6%, a difference of 0.090%), Nicaraguan (10.6%, a difference of 0.29%), Cuban (10.6%, a difference of 0.34%), Immigrants from Burma/Myanmar (10.5%, a difference of 0.64%), and Salvadoran (10.7%, a difference of 0.87%).
DemographicsRating | RankFamily Poverty
Potawatomi
1.5
/100
|
#239
Tragic
10.2%
Immigrants | Azores
1.4
/100
|
#240
Tragic
10.3%
Ghanaians
1.3
/100
|
#241
Tragic
10.3%
Alaska Natives
1.0
/100
|
#242
Tragic
10.4%
Nepalese
0.8
/100
|
#243
Tragic
10.4%
Cree
0.7
/100
|
#244
Tragic
10.5%
Immigrants | Burma/Myanmar
0.6
/100
|
#245
Tragic
10.5%
Cherokee
0.5
/100
|
#246
Tragic
10.6%
Liberians
0.4
/100
|
#247
Tragic
10.6%
Nicaraguans
0.4
/100
|
#248
Tragic
10.6%
Cubans
0.4
/100
|
#249
Tragic
10.6%
Salvadorans
0.3
/100
|
#250
Tragic
10.7%
Iroquois
0.3
/100
|
#251
Tragic
10.7%
Immigrants | Zaire
0.3
/100
|
#252
Tragic
10.7%
Immigrants | Western Africa
0.3
/100
|
#253
Tragic
10.7%

Demographics Similar to Immigrants from Morocco by Family Poverty

In terms of family poverty, the demographic groups most similar to Immigrants from Morocco are Hmong (9.1%, a difference of 0.010%), Uruguayan (9.1%, a difference of 0.13%), South American Indian (9.1%, a difference of 0.20%), Immigrants from Saudi Arabia (9.1%, a difference of 0.21%), and Immigrants from Uganda (9.1%, a difference of 0.43%).
DemographicsRating | RankFamily Poverty
Costa Ricans
49.3
/100
|
#175
Average
9.0%
Immigrants | Syria
47.5
/100
|
#176
Average
9.0%
Hawaiians
47.2
/100
|
#177
Average
9.0%
Immigrants | Cameroon
47.1
/100
|
#178
Average
9.0%
Immigrants | Iraq
44.4
/100
|
#179
Average
9.1%
Immigrants | Uganda
43.4
/100
|
#180
Average
9.1%
Hmong
40.2
/100
|
#181
Average
9.1%
Immigrants | Morocco
40.2
/100
|
#182
Average
9.1%
Uruguayans
39.2
/100
|
#183
Fair
9.1%
South American Indians
38.7
/100
|
#184
Fair
9.1%
Immigrants | Saudi Arabia
38.6
/100
|
#185
Fair
9.1%
Colombians
36.1
/100
|
#186
Fair
9.2%
Delaware
35.4
/100
|
#187
Fair
9.2%
Immigrants | Kenya
34.0
/100
|
#188
Fair
9.2%
Immigrants | Afghanistan
32.1
/100
|
#189
Fair
9.2%