Cherokee vs Immigrants from Afghanistan Female Poverty
COMPARE
Cherokee
Immigrants from Afghanistan
Female Poverty
Female Poverty Comparison
Cherokee
Immigrants from Afghanistan
15.6%
FEMALE POVERTY
0.1/ 100
METRIC RATING
263rd/ 347
METRIC RANK
13.4%
FEMALE POVERTY
50.8/ 100
METRIC RATING
173rd/ 347
METRIC RANK
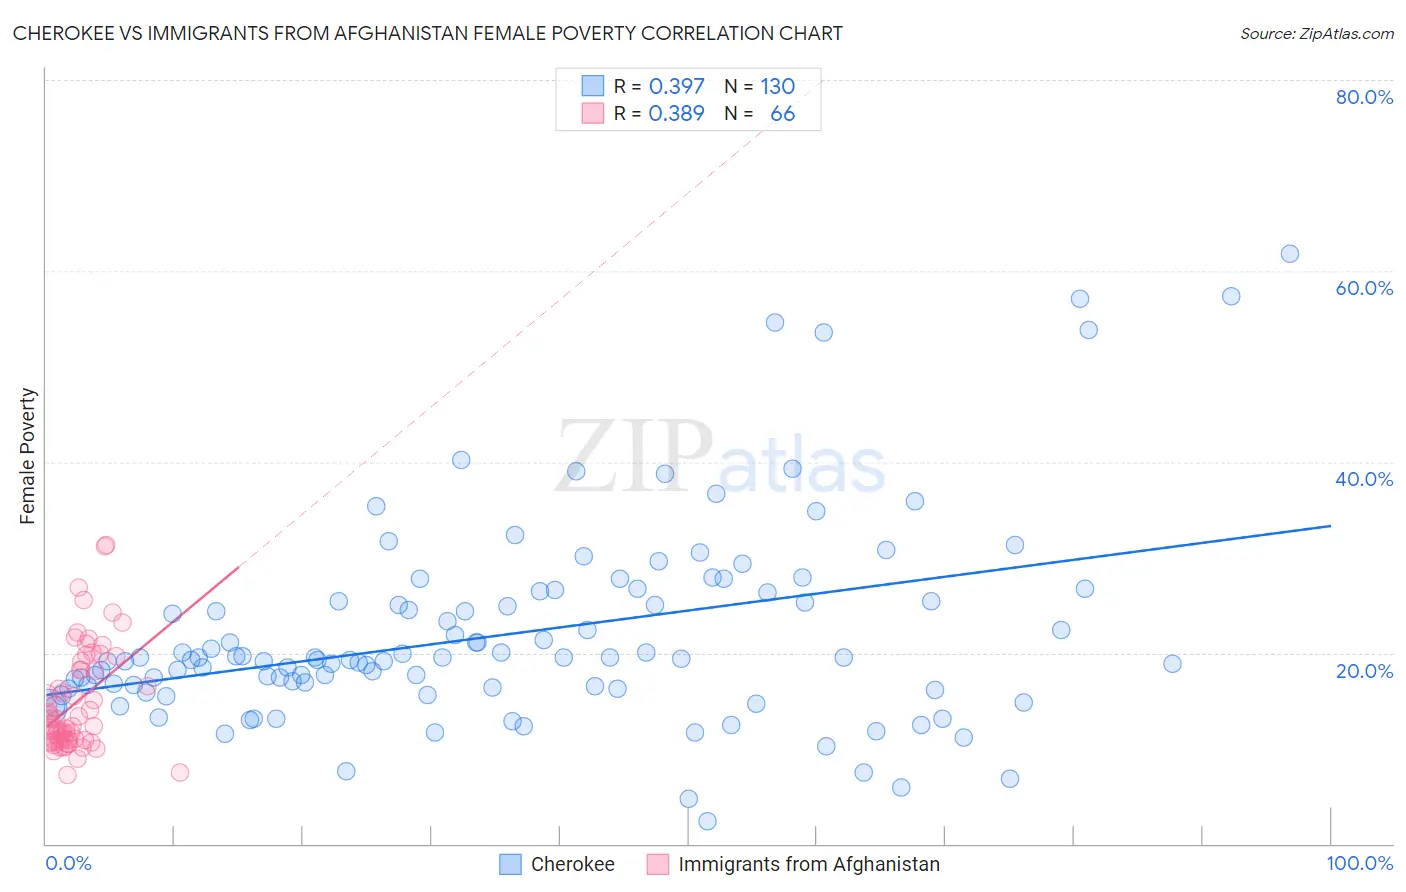
Cherokee vs Immigrants from Afghanistan Female Poverty Correlation Chart
The statistical analysis conducted on geographies consisting of 493,220,722 people shows a mild positive correlation between the proportion of Cherokee and poverty level among females in the United States with a correlation coefficient (R) of 0.397 and weighted average of 15.6%. Similarly, the statistical analysis conducted on geographies consisting of 147,630,543 people shows a mild positive correlation between the proportion of Immigrants from Afghanistan and poverty level among females in the United States with a correlation coefficient (R) of 0.389 and weighted average of 13.4%, a difference of 16.2%.
Female Poverty Correlation Summary
| Measurement | Cherokee | Immigrants from Afghanistan |
| Minimum | 2.3% | 7.2% |
| Maximum | 61.8% | 31.3% |
| Range | 59.5% | 24.1% |
| Mean | 21.9% | 14.8% |
| Median | 19.3% | 12.4% |
| Interquartile 25% (IQ1) | 16.3% | 10.8% |
| Interquartile 75% (IQ3) | 25.5% | 18.2% |
| Interquartile Range (IQR) | 9.2% | 7.4% |
| Standard Deviation (Sample) | 10.5% | 5.5% |
| Standard Deviation (Population) | 10.5% | 5.4% |
Similar Demographics by Female Poverty
Demographics Similar to Cherokee by Female Poverty
In terms of female poverty, the demographic groups most similar to Cherokee are Guyanese (15.6%, a difference of 0.010%), Mexican American Indian (15.6%, a difference of 0.010%), Immigrants from Guyana (15.6%, a difference of 0.11%), Immigrants from Ecuador (15.6%, a difference of 0.13%), and Cape Verdean (15.6%, a difference of 0.19%).
| Demographics | Rating | Rank | Female Poverty |
| Jamaicans | 0.2 /100 | #256 | Tragic 15.5% |
| Immigrants | Jamaica | 0.1 /100 | #257 | Tragic 15.6% |
| Shoshone | 0.1 /100 | #258 | Tragic 15.6% |
| Cape Verdeans | 0.1 /100 | #259 | Tragic 15.6% |
| Immigrants | Guyana | 0.1 /100 | #260 | Tragic 15.6% |
| Guyanese | 0.1 /100 | #261 | Tragic 15.6% |
| Mexican American Indians | 0.1 /100 | #262 | Tragic 15.6% |
| Cherokee | 0.1 /100 | #263 | Tragic 15.6% |
| Immigrants | Ecuador | 0.1 /100 | #264 | Tragic 15.6% |
| Immigrants | Liberia | 0.1 /100 | #265 | Tragic 15.7% |
| Immigrants | El Salvador | 0.1 /100 | #266 | Tragic 15.7% |
| Sub-Saharan Africans | 0.1 /100 | #267 | Tragic 15.8% |
| Immigrants | Nicaragua | 0.1 /100 | #268 | Tragic 15.8% |
| Iroquois | 0.1 /100 | #269 | Tragic 15.8% |
| Chickasaw | 0.1 /100 | #270 | Tragic 15.9% |
Demographics Similar to Immigrants from Afghanistan by Female Poverty
In terms of female poverty, the demographic groups most similar to Immigrants from Afghanistan are Immigrants from Iraq (13.4%, a difference of 0.070%), Celtic (13.4%, a difference of 0.080%), Immigrants from Spain (13.4%, a difference of 0.090%), Immigrants from Morocco (13.4%, a difference of 0.13%), and Israeli (13.5%, a difference of 0.16%).
| Demographics | Rating | Rank | Female Poverty |
| Immigrants | Oceania | 59.7 /100 | #166 | Average 13.3% |
| Immigrants | Chile | 57.4 /100 | #167 | Average 13.3% |
| Aleuts | 56.7 /100 | #168 | Average 13.4% |
| Lebanese | 55.9 /100 | #169 | Average 13.4% |
| Colombians | 55.7 /100 | #170 | Average 13.4% |
| Whites/Caucasians | 54.6 /100 | #171 | Average 13.4% |
| Mongolians | 53.6 /100 | #172 | Average 13.4% |
| Immigrants | Afghanistan | 50.8 /100 | #173 | Average 13.4% |
| Immigrants | Iraq | 50.0 /100 | #174 | Average 13.4% |
| Celtics | 49.9 /100 | #175 | Average 13.4% |
| Immigrants | Spain | 49.9 /100 | #176 | Average 13.4% |
| Immigrants | Morocco | 49.4 /100 | #177 | Average 13.4% |
| Israelis | 49.1 /100 | #178 | Average 13.5% |
| Immigrants | Syria | 48.8 /100 | #179 | Average 13.5% |
| South Americans | 44.8 /100 | #180 | Average 13.5% |