Cherokee vs Haitian Single Female Poverty
COMPARE
Cherokee
Haitian
Single Female Poverty
Single Female Poverty Comparison
Cherokee
Haitians
25.7%
SINGLE FEMALE POVERTY
0.0/ 100
METRIC RATING
314th/ 347
METRIC RANK
21.6%
SINGLE FEMALE POVERTY
15.4/ 100
METRIC RATING
208th/ 347
METRIC RANK
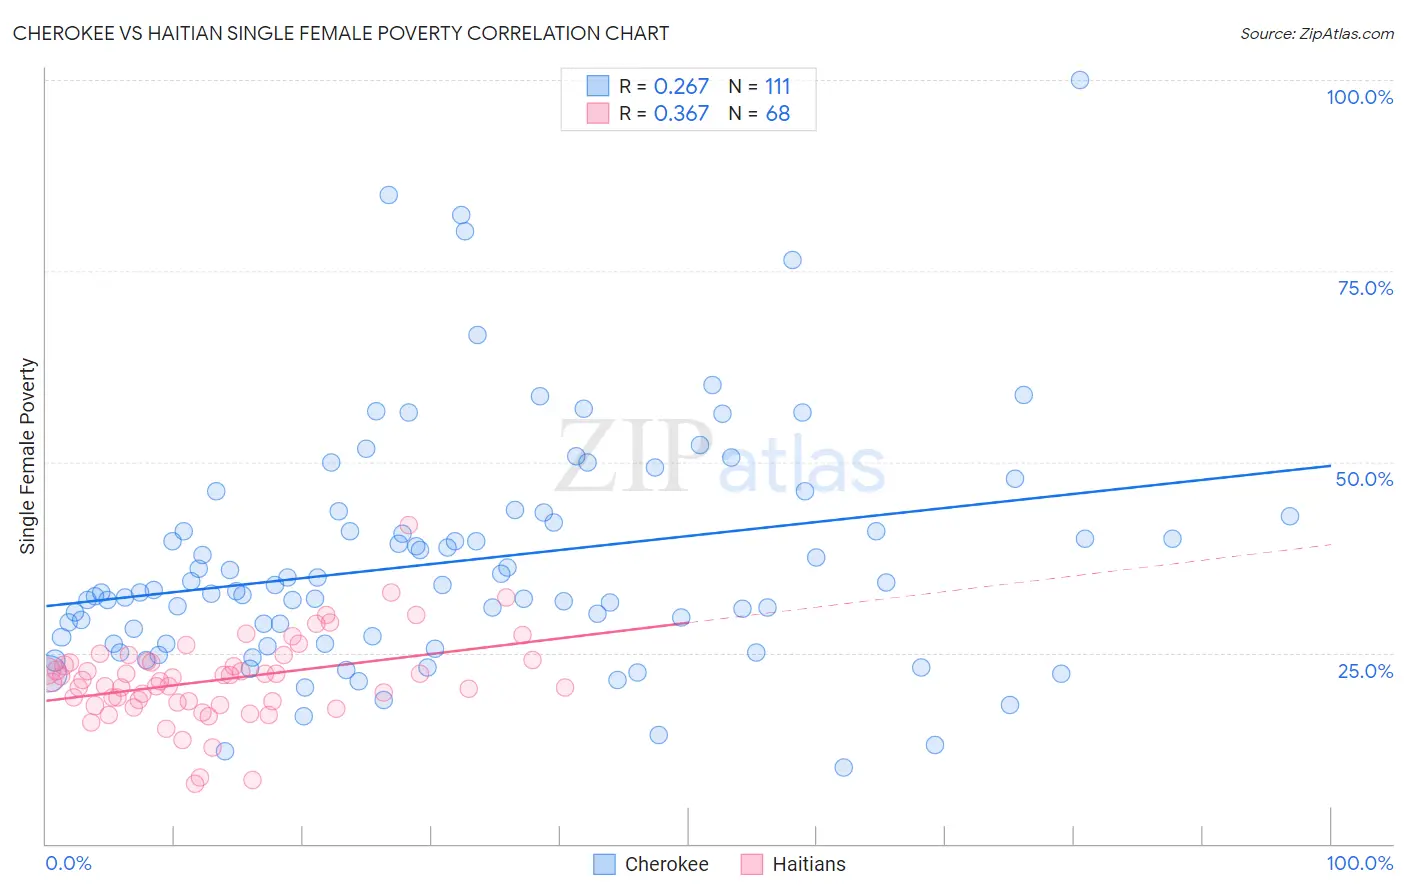
Cherokee vs Haitian Single Female Poverty Correlation Chart
The statistical analysis conducted on geographies consisting of 484,754,756 people shows a weak positive correlation between the proportion of Cherokee and poverty level among single females in the United States with a correlation coefficient (R) of 0.267 and weighted average of 25.7%. Similarly, the statistical analysis conducted on geographies consisting of 284,824,358 people shows a mild positive correlation between the proportion of Haitians and poverty level among single females in the United States with a correlation coefficient (R) of 0.367 and weighted average of 21.6%, a difference of 19.0%.
Single Female Poverty Correlation Summary
| Measurement | Cherokee | Haitian |
| Minimum | 10.0% | 7.9% |
| Maximum | 100.0% | 41.8% |
| Range | 90.0% | 33.9% |
| Mean | 37.0% | 21.5% |
| Median | 33.1% | 21.3% |
| Interquartile 25% (IQ1) | 26.2% | 18.6% |
| Interquartile 75% (IQ3) | 42.9% | 23.8% |
| Interquartile Range (IQR) | 16.6% | 5.2% |
| Standard Deviation (Sample) | 15.5% | 5.6% |
| Standard Deviation (Population) | 15.4% | 5.5% |
Similar Demographics by Single Female Poverty
Demographics Similar to Cherokee by Single Female Poverty
In terms of single female poverty, the demographic groups most similar to Cherokee are Iroquois (25.7%, a difference of 0.32%), Comanche (25.6%, a difference of 0.36%), Paiute (25.5%, a difference of 0.47%), Immigrants from Somalia (25.8%, a difference of 0.47%), and Immigrants from Honduras (25.5%, a difference of 0.51%).
| Demographics | Rating | Rank | Single Female Poverty |
| Potawatomi | 0.0 /100 | #307 | Tragic 25.4% |
| Aleuts | 0.0 /100 | #308 | Tragic 25.4% |
| Dominicans | 0.0 /100 | #309 | Tragic 25.4% |
| Central American Indians | 0.0 /100 | #310 | Tragic 25.5% |
| Immigrants | Honduras | 0.0 /100 | #311 | Tragic 25.5% |
| Paiute | 0.0 /100 | #312 | Tragic 25.5% |
| Comanche | 0.0 /100 | #313 | Tragic 25.6% |
| Cherokee | 0.0 /100 | #314 | Tragic 25.7% |
| Iroquois | 0.0 /100 | #315 | Tragic 25.7% |
| Immigrants | Somalia | 0.0 /100 | #316 | Tragic 25.8% |
| Ottawa | 0.0 /100 | #317 | Tragic 26.0% |
| Chickasaw | 0.0 /100 | #318 | Tragic 26.3% |
| Blacks/African Americans | 0.0 /100 | #319 | Tragic 26.4% |
| Arapaho | 0.0 /100 | #320 | Tragic 26.4% |
| Yup'ik | 0.0 /100 | #321 | Tragic 26.6% |
Demographics Similar to Haitians by Single Female Poverty
In terms of single female poverty, the demographic groups most similar to Haitians are Immigrants from Eastern Africa (21.6%, a difference of 0.030%), Ghanaian (21.6%, a difference of 0.040%), Belgian (21.5%, a difference of 0.070%), Finnish (21.5%, a difference of 0.090%), and Immigrants from Panama (21.6%, a difference of 0.12%).
| Demographics | Rating | Rank | Single Female Poverty |
| Nigerians | 20.9 /100 | #201 | Fair 21.4% |
| Immigrants | Kenya | 20.7 /100 | #202 | Fair 21.4% |
| Immigrants | Haiti | 18.8 /100 | #203 | Poor 21.5% |
| Immigrants | Africa | 16.7 /100 | #204 | Poor 21.5% |
| Finns | 16.2 /100 | #205 | Poor 21.5% |
| Belgians | 16.1 /100 | #206 | Poor 21.5% |
| Ghanaians | 15.7 /100 | #207 | Poor 21.6% |
| Haitians | 15.4 /100 | #208 | Poor 21.6% |
| Immigrants | Eastern Africa | 15.1 /100 | #209 | Poor 21.6% |
| Immigrants | Panama | 14.4 /100 | #210 | Poor 21.6% |
| Icelanders | 14.0 /100 | #211 | Poor 21.6% |
| Jamaicans | 14.0 /100 | #212 | Poor 21.6% |
| Guamanians/Chamorros | 13.7 /100 | #213 | Poor 21.6% |
| Immigrants | Nicaragua | 13.3 /100 | #214 | Poor 21.6% |
| Ecuadorians | 12.3 /100 | #215 | Poor 21.6% |