Cherokee vs Alaskan Athabascan Single Female Poverty
COMPARE
Cherokee
Alaskan Athabascan
Single Female Poverty
Single Female Poverty Comparison
Cherokee
Alaskan Athabascans
25.7%
SINGLE FEMALE POVERTY
0.0/ 100
METRIC RATING
314th/ 347
METRIC RANK
23.6%
SINGLE FEMALE POVERTY
0.0/ 100
METRIC RATING
279th/ 347
METRIC RANK
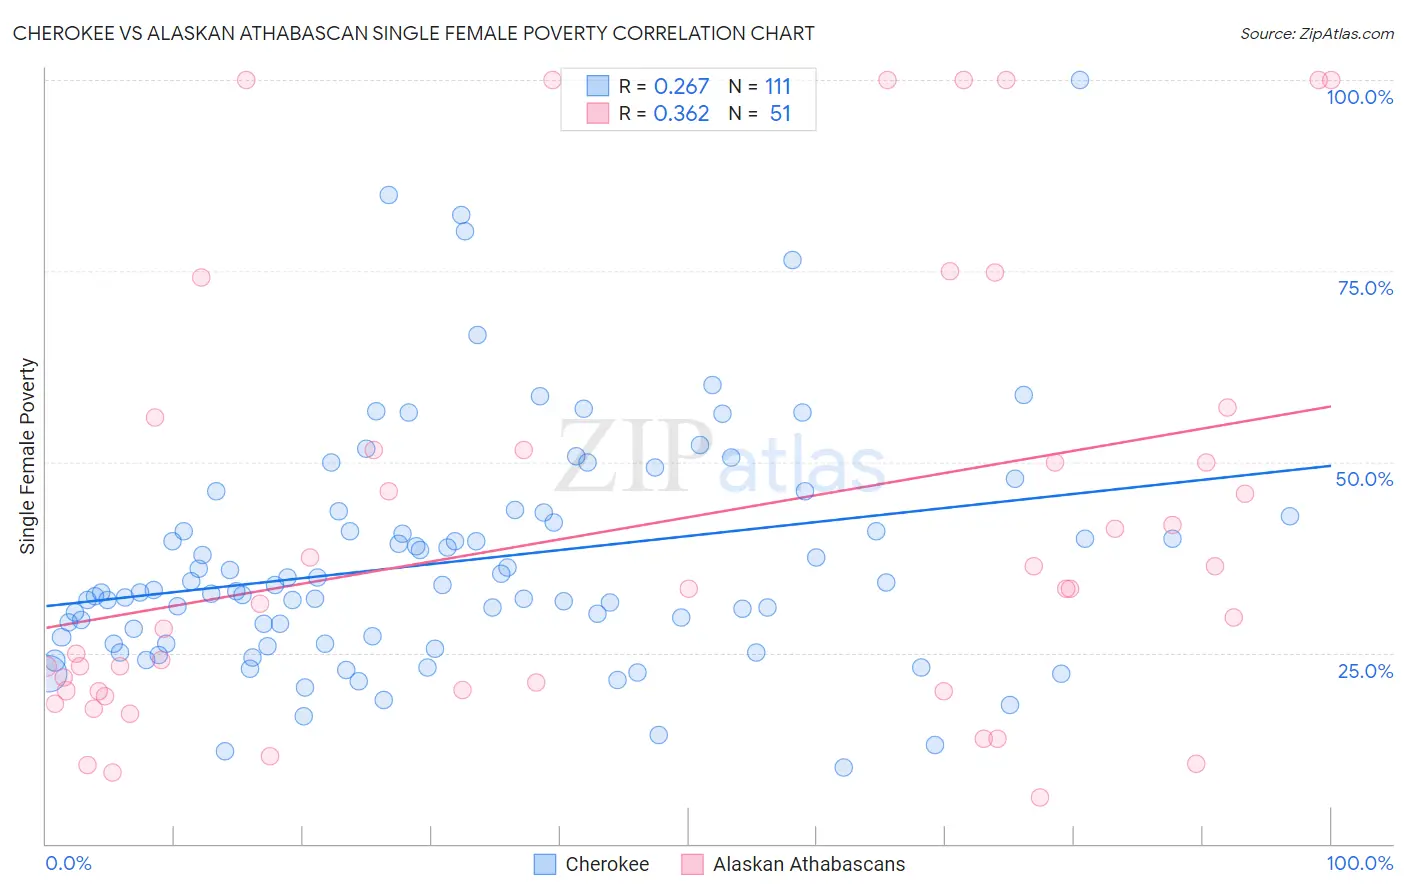
Cherokee vs Alaskan Athabascan Single Female Poverty Correlation Chart
The statistical analysis conducted on geographies consisting of 484,754,756 people shows a weak positive correlation between the proportion of Cherokee and poverty level among single females in the United States with a correlation coefficient (R) of 0.267 and weighted average of 25.7%. Similarly, the statistical analysis conducted on geographies consisting of 45,584,348 people shows a mild positive correlation between the proportion of Alaskan Athabascans and poverty level among single females in the United States with a correlation coefficient (R) of 0.362 and weighted average of 23.6%, a difference of 8.7%.
Single Female Poverty Correlation Summary
| Measurement | Cherokee | Alaskan Athabascan |
| Minimum | 10.0% | 6.0% |
| Maximum | 100.0% | 100.0% |
| Range | 90.0% | 94.0% |
| Mean | 37.0% | 41.2% |
| Median | 33.1% | 33.3% |
| Interquartile 25% (IQ1) | 26.2% | 20.0% |
| Interquartile 75% (IQ3) | 42.9% | 51.6% |
| Interquartile Range (IQR) | 16.6% | 31.6% |
| Standard Deviation (Sample) | 15.5% | 28.9% |
| Standard Deviation (Population) | 15.4% | 28.7% |
Similar Demographics by Single Female Poverty
Demographics Similar to Cherokee by Single Female Poverty
In terms of single female poverty, the demographic groups most similar to Cherokee are Iroquois (25.7%, a difference of 0.32%), Comanche (25.6%, a difference of 0.36%), Paiute (25.5%, a difference of 0.47%), Immigrants from Somalia (25.8%, a difference of 0.47%), and Immigrants from Honduras (25.5%, a difference of 0.51%).
| Demographics | Rating | Rank | Single Female Poverty |
| Potawatomi | 0.0 /100 | #307 | Tragic 25.4% |
| Aleuts | 0.0 /100 | #308 | Tragic 25.4% |
| Dominicans | 0.0 /100 | #309 | Tragic 25.4% |
| Central American Indians | 0.0 /100 | #310 | Tragic 25.5% |
| Immigrants | Honduras | 0.0 /100 | #311 | Tragic 25.5% |
| Paiute | 0.0 /100 | #312 | Tragic 25.5% |
| Comanche | 0.0 /100 | #313 | Tragic 25.6% |
| Cherokee | 0.0 /100 | #314 | Tragic 25.7% |
| Iroquois | 0.0 /100 | #315 | Tragic 25.7% |
| Immigrants | Somalia | 0.0 /100 | #316 | Tragic 25.8% |
| Ottawa | 0.0 /100 | #317 | Tragic 26.0% |
| Chickasaw | 0.0 /100 | #318 | Tragic 26.3% |
| Blacks/African Americans | 0.0 /100 | #319 | Tragic 26.4% |
| Arapaho | 0.0 /100 | #320 | Tragic 26.4% |
| Yup'ik | 0.0 /100 | #321 | Tragic 26.6% |
Demographics Similar to Alaskan Athabascans by Single Female Poverty
In terms of single female poverty, the demographic groups most similar to Alaskan Athabascans are Nonimmigrants (23.6%, a difference of 0.040%), Pennsylvania German (23.6%, a difference of 0.11%), Immigrants from the Azores (23.5%, a difference of 0.27%), Immigrants from Latin America (23.7%, a difference of 0.49%), and Immigrants from Zaire (23.8%, a difference of 1.0%).
| Demographics | Rating | Rank | Single Female Poverty |
| Immigrants | Senegal | 0.1 /100 | #272 | Tragic 23.2% |
| Alaska Natives | 0.1 /100 | #273 | Tragic 23.3% |
| Marshallese | 0.1 /100 | #274 | Tragic 23.3% |
| Mexican American Indians | 0.1 /100 | #275 | Tragic 23.4% |
| Immigrants | Azores | 0.0 /100 | #276 | Tragic 23.5% |
| Pennsylvania Germans | 0.0 /100 | #277 | Tragic 23.6% |
| Immigrants | Nonimmigrants | 0.0 /100 | #278 | Tragic 23.6% |
| Alaskan Athabascans | 0.0 /100 | #279 | Tragic 23.6% |
| Immigrants | Latin America | 0.0 /100 | #280 | Tragic 23.7% |
| Immigrants | Zaire | 0.0 /100 | #281 | Tragic 23.8% |
| Guatemalans | 0.0 /100 | #282 | Tragic 23.8% |
| German Russians | 0.0 /100 | #283 | Tragic 23.9% |
| Immigrants | Dominica | 0.0 /100 | #284 | Tragic 23.9% |
| Immigrants | Guatemala | 0.0 /100 | #285 | Tragic 24.1% |
| Cree | 0.0 /100 | #286 | Tragic 24.1% |