Cambodian vs Bermudan Child Poverty Among Boys Under 16

COMPARE

Cambodian
Race
Ancestry
AfghanAfricanAlaska NativeAlaskan AthabascanAlbanianAleutAlsatianAmericanApacheArabArapahoArgentineanArmenianAssyrian/Chaldean/SyriacAustralianAustrianBahamianBangladeshiBarbadianBasqueBelgianBelizeanBhutaneseBlackfeetBolivianBrazilianBritishBritish West IndianBulgarianBurmeseCajunCambodianCanadianCape VerdeanCarpatho RusynCelticCentral AmericanCentral American IndianCherokeeCheyenneChickasawChileanChineseChippewaChoctawColombianColvilleComancheCosta RicanCreeCreekCroatianCrowCubanCypriotCzechCzechoslovakianDanishDelawareDominicanDutchDutch West IndianEastern EuropeanEcuadorianEgyptianEnglishEstonianEthiopianEuropeanFijianFilipinoFinnishFrenchFrench American IndianFrench CanadianGermanGerman RussianGhanaianGreekGuamanian/ChamorroGuatemalanGuyaneseHaitianHmongHonduranHopiHoumaHungarianIcelanderIndian (Asian)IndonesianInupiatIranianIraqiIrishIroquoisIsraeliItalianJamaicanJapaneseJordanianKenyanKiowaKoreanLaotianLatvianLebaneseLiberianLithuanianLumbeeLuxembourgerMacedonianMalaysianMalteseMarshalleseMenomineeMexicanMexican American IndianMongolianMoroccanNative HawaiianNavajoNepaleseNew ZealanderNicaraguanNigerianNorthern EuropeanNorwegianOkinawanOsageOttawaPaiutePakistaniPalestinianPanamanianParaguayanPennsylvania GermanPeruvianPimaPolishPortuguesePotawatomiPuebloPuerto RicanPuget Sound SalishRomanianRussianSalvadoranSamoanScandinavianScotch-IrishScottishSeminoleSenegaleseSerbianShoshoneSierra LeoneanSiouxSlavicSlovakSloveneSomaliSouth AfricanSouth AmericanSouth American IndianSoviet UnionSpaniardSpanishSpanish AmericanSpanish American IndianSri LankanSubsaharan AfricanSudaneseSwedishSwissSyrianTaiwaneseThaiTlingit-HaidaTohono O'OdhamTonganTrinidadian and TobagonianTsimshianTurkishU.S. Virgin IslanderUgandanUkrainianUruguayanUteVenezuelanVietnameseWelshWest IndianYakamaYaquiYugoslavianYumanYup'ikZimbabwean
Immigration
NonimmigrantsImmigrantsAfghanistanAfricaAlbaniaArgentinaArmeniaAsiaAustraliaAustriaBahamasBangladeshBarbadosBelarusBelgiumBelizeBoliviaBosnia and HerzegovinaBrazilBulgariaBurma/MyanmarCabo VerdeCambodiaCameroonCanadaCaribbeanCentral AmericaChileChinaColombiaCongoCosta RicaCroatiaCubaCzechoslovakiaDenmarkDominicaDominican RepublicEastern AfricaEastern AsiaEastern EuropeEcuadorEgyptEl SalvadorEnglandEritreaEthiopiaEuropeFijiFranceGermanyGhanaGreeceGrenadaGuatemalaGuyanaHaitiHondurasHong KongHungaryIndiaIndonesiaIranIraqIrelandIsraelItalyJamaicaJapanJordanKazakhstanKenyaKoreaKuwaitLaosLatin AmericaLatviaLebanonLiberiaLithuaniaMalaysiaMexicoMicronesiaMiddle AfricaMoldovaMoroccoNepalNetherlandsNicaraguaNigeriaNorth AmericaNorth MacedoniaNorthern AfricaNorthern EuropeNorwayOceaniaPakistanPanamaPeruPhilippinesPolandPortugalRomaniaRussiaSaudi ArabiaScotlandSenegalSerbiaSierra LeoneSingaporeSomaliaSouth AfricaSouth AmericaSouth Central AsiaSouth Eastern AsiaSouthern EuropeSpainSri LankaSt. Vincent and the GrenadinesSudanSwedenSwitzerlandSyriaTaiwanThailandTrinidad and TobagoTurkeyUgandaUkraineUruguayUzbekistanVenezuelaVietnamWest IndiesWestern AfricaWestern AsiaWestern EuropeYemenZaireZimbabweAzores
Bermudan
Race
Ancestry
AfghanAfricanAlaska NativeAlaskan AthabascanAlbanianAleutAlsatianAmericanApacheArabArapahoArgentineanArmenianAssyrian/Chaldean/SyriacAustralianAustrianBahamianBangladeshiBarbadianBasqueBelgianBelizeanBermudanBhutaneseBlackfeetBolivianBrazilianBritishBritish West IndianBulgarianBurmeseCajunCanadianCape VerdeanCarpatho RusynCelticCentral AmericanCentral American IndianCherokeeCheyenneChickasawChileanChineseChippewaChoctawColombianColvilleComancheCosta RicanCreeCreekCroatianCrowCubanCypriotCzechCzechoslovakianDanishDelawareDominicanDutchDutch West IndianEastern EuropeanEcuadorianEgyptianEnglishEstonianEthiopianEuropeanFijianFilipinoFinnishFrenchFrench American IndianFrench CanadianGermanGerman RussianGhanaianGreekGuamanian/ChamorroGuatemalanGuyaneseHaitianHmongHonduranHopiHoumaHungarianIcelanderIndian (Asian)IndonesianInupiatIranianIraqiIrishIroquoisIsraeliItalianJamaicanJapaneseJordanianKenyanKiowaKoreanLaotianLatvianLebaneseLiberianLithuanianLumbeeLuxembourgerMacedonianMalaysianMalteseMarshalleseMenomineeMexicanMexican American IndianMongolianMoroccanNative HawaiianNavajoNepaleseNew ZealanderNicaraguanNigerianNorthern EuropeanNorwegianOkinawanOsageOttawaPaiutePakistaniPalestinianPanamanianParaguayanPennsylvania GermanPeruvianPimaPolishPortuguesePotawatomiPuebloPuerto RicanPuget Sound SalishRomanianRussianSalvadoranSamoanScandinavianScotch-IrishScottishSeminoleSenegaleseSerbianShoshoneSierra LeoneanSiouxSlavicSlovakSloveneSomaliSouth AfricanSouth AmericanSouth American IndianSoviet UnionSpaniardSpanishSpanish AmericanSpanish American IndianSri LankanSubsaharan AfricanSudaneseSwedishSwissSyrianTaiwaneseThaiTlingit-HaidaTohono O'OdhamTonganTrinidadian and TobagonianTsimshianTurkishU.S. Virgin IslanderUgandanUkrainianUruguayanUteVenezuelanVietnameseWelshWest IndianYakamaYaquiYugoslavianYumanYup'ikZimbabwean
Immigration
NonimmigrantsImmigrantsAfghanistanAfricaAlbaniaArgentinaArmeniaAsiaAustraliaAustriaBahamasBangladeshBarbadosBelarusBelgiumBelizeBoliviaBosnia and HerzegovinaBrazilBulgariaBurma/MyanmarCabo VerdeCambodiaCameroonCanadaCaribbeanCentral AmericaChileChinaColombiaCongoCosta RicaCroatiaCubaCzechoslovakiaDenmarkDominicaDominican RepublicEastern AfricaEastern AsiaEastern EuropeEcuadorEgyptEl SalvadorEnglandEritreaEthiopiaEuropeFijiFranceGermanyGhanaGreeceGrenadaGuatemalaGuyanaHaitiHondurasHong KongHungaryIndiaIndonesiaIranIraqIrelandIsraelItalyJamaicaJapanJordanKazakhstanKenyaKoreaKuwaitLaosLatin AmericaLatviaLebanonLiberiaLithuaniaMalaysiaMexicoMicronesiaMiddle AfricaMoldovaMoroccoNepalNetherlandsNicaraguaNigeriaNorth AmericaNorth MacedoniaNorthern AfricaNorthern EuropeNorwayOceaniaPakistanPanamaPeruPhilippinesPolandPortugalRomaniaRussiaSaudi ArabiaScotlandSenegalSerbiaSierra LeoneSingaporeSomaliaSouth AfricaSouth AmericaSouth Central AsiaSouth Eastern AsiaSouthern EuropeSpainSri LankaSt. Vincent and the GrenadinesSudanSwedenSwitzerlandSyriaTaiwanThailandTrinidad and TobagoTurkeyUgandaUkraineUruguayUzbekistanVenezuelaVietnamWest IndiesWestern AfricaWestern AsiaWestern EuropeYemenZaireZimbabweAzores
Child Poverty Among Boys Under 16
Income
Poverty
Unemployment
Labor Participation
Family Structure
Vehicle Availability
Education Level
Disability

Child Poverty Among Boys Under 16 Comparison

Cambodians

Bermudans

Exceptional
Tragic
14.5%
CHILD POVERTY AMONG BOYS UNDER 16
98.5/ 100
METRIC RATING
63rd/ 347
METRIC RANK
18.1%
CHILD POVERTY AMONG BOYS UNDER 16
2.5/ 100
METRIC RATING
227th/ 347
METRIC RANK

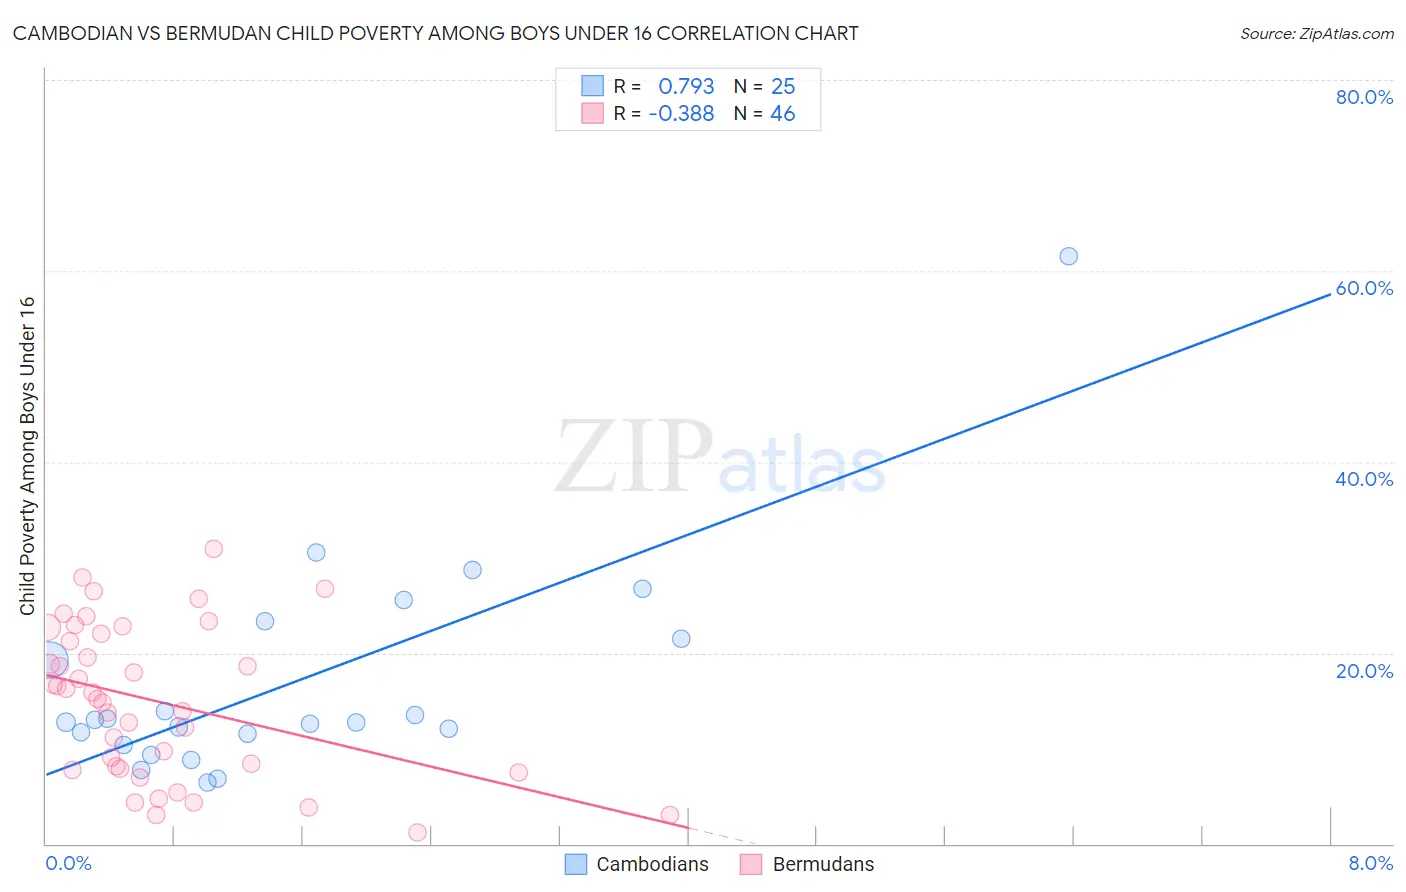
Cambodian vs Bermudan Child Poverty Among Boys Under 16 Correlation Chart

The statistical analysis conducted on geographies consisting of 102,113,836 people shows a strong positive correlation between the proportion of Cambodians and poverty level among boys under the age of 16 in the United States with a correlation coefficient (R) of 0.793 and weighted average of 14.5%. Similarly, the statistical analysis conducted on geographies consisting of 55,633,001 people shows a mild negative correlation between the proportion of Bermudans and poverty level among boys under the age of 16 in the United States with a correlation coefficient (R) of -0.388 and weighted average of 18.1%, a difference of 24.9%.
Cambodian vs Bermudan Child Poverty Among Boys Under 16

Child Poverty Among Boys Under 16 Correlation Summary

MeasurementCambodianBermudan
Minimum6.4%1.2%
Maximum61.5%31.0%
Range55.1%29.7%
Mean17.0%14.9%
Median12.7%15.5%
Interquartile 25% (IQ1)10.9%7.8%
Interquartile 75% (IQ3)22.4%22.0%
Interquartile Range (IQR)11.4%14.2%
Standard Deviation (Sample)11.6%7.9%
Standard Deviation (Population)11.4%7.8%

Similar Demographics by Child Poverty Among Boys Under 16

Demographics Similar to Cambodians by Child Poverty Among Boys Under 16

In terms of child poverty among boys under 16, the demographic groups most similar to Cambodians are Immigrants from Romania (14.5%, a difference of 0.13%), Soviet Union (14.5%, a difference of 0.16%), Immigrants from Bulgaria (14.5%, a difference of 0.17%), Immigrants from Europe (14.5%, a difference of 0.19%), and Slovene (14.5%, a difference of 0.28%).
DemographicsRating | RankChild Poverty Among Boys Under 16
Zimbabweans
99.0
/100
|
#56
Exceptional
14.3%
Poles
98.9
/100
|
#57
Exceptional
14.4%
Immigrants | Sweden
98.9
/100
|
#58
Exceptional
14.4%
Immigrants | Czechoslovakia
98.9
/100
|
#59
Exceptional
14.4%
Immigrants | Belgium
98.9
/100
|
#60
Exceptional
14.4%
Scandinavians
98.8
/100
|
#61
Exceptional
14.4%
Immigrants | Israel
98.7
/100
|
#62
Exceptional
14.4%
Cambodians
98.5
/100
|
#63
Exceptional
14.5%
Immigrants | Romania
98.5
/100
|
#64
Exceptional
14.5%
Soviet Union
98.5
/100
|
#65
Exceptional
14.5%
Immigrants | Bulgaria
98.5
/100
|
#66
Exceptional
14.5%
Immigrants | Europe
98.4
/100
|
#67
Exceptional
14.5%
Slovenes
98.4
/100
|
#68
Exceptional
14.5%
Immigrants | Austria
98.4
/100
|
#69
Exceptional
14.5%
Europeans
98.4
/100
|
#70
Exceptional
14.5%

Demographics Similar to Bermudans by Child Poverty Among Boys Under 16

In terms of child poverty among boys under 16, the demographic groups most similar to Bermudans are Immigrants from Africa (18.1%, a difference of 0.10%), Inupiat (18.1%, a difference of 0.26%), Nonimmigrants (18.2%, a difference of 0.33%), Nepalese (18.0%, a difference of 0.67%), and Immigrants from Micronesia (18.3%, a difference of 0.85%).
DemographicsRating | RankChild Poverty Among Boys Under 16
Immigrants | Cambodia
5.1
/100
|
#220
Tragic
17.8%
Immigrants | Panama
4.3
/100
|
#221
Tragic
17.9%
Pennsylvania Germans
3.9
/100
|
#222
Tragic
17.9%
Cubans
3.8
/100
|
#223
Tragic
17.9%
Nepalese
3.2
/100
|
#224
Tragic
18.0%
Inupiat
2.7
/100
|
#225
Tragic
18.1%
Immigrants | Africa
2.6
/100
|
#226
Tragic
18.1%
Bermudans
2.5
/100
|
#227
Tragic
18.1%
Immigrants | Nonimmigrants
2.2
/100
|
#228
Tragic
18.2%
Immigrants | Micronesia
1.8
/100
|
#229
Tragic
18.3%
Fijians
1.8
/100
|
#230
Tragic
18.3%
Nicaraguans
1.4
/100
|
#231
Tragic
18.4%
Marshallese
1.3
/100
|
#232
Tragic
18.4%
Immigrants | Nigeria
1.2
/100
|
#233
Tragic
18.4%
Nigerians
1.1
/100
|
#234
Tragic
18.5%