British vs Creek Child Poverty Among Girls Under 16
COMPARE
British
Creek
Child Poverty Among Girls Under 16
Child Poverty Among Girls Under 16 Comparison
British
Creek
15.0%
CHILD POVERTY AMONG GIRLS UNDER 16
95.6/ 100
METRIC RATING
103rd/ 347
METRIC RANK
21.7%
CHILD POVERTY AMONG GIRLS UNDER 16
0.0/ 100
METRIC RATING
313th/ 347
METRIC RANK
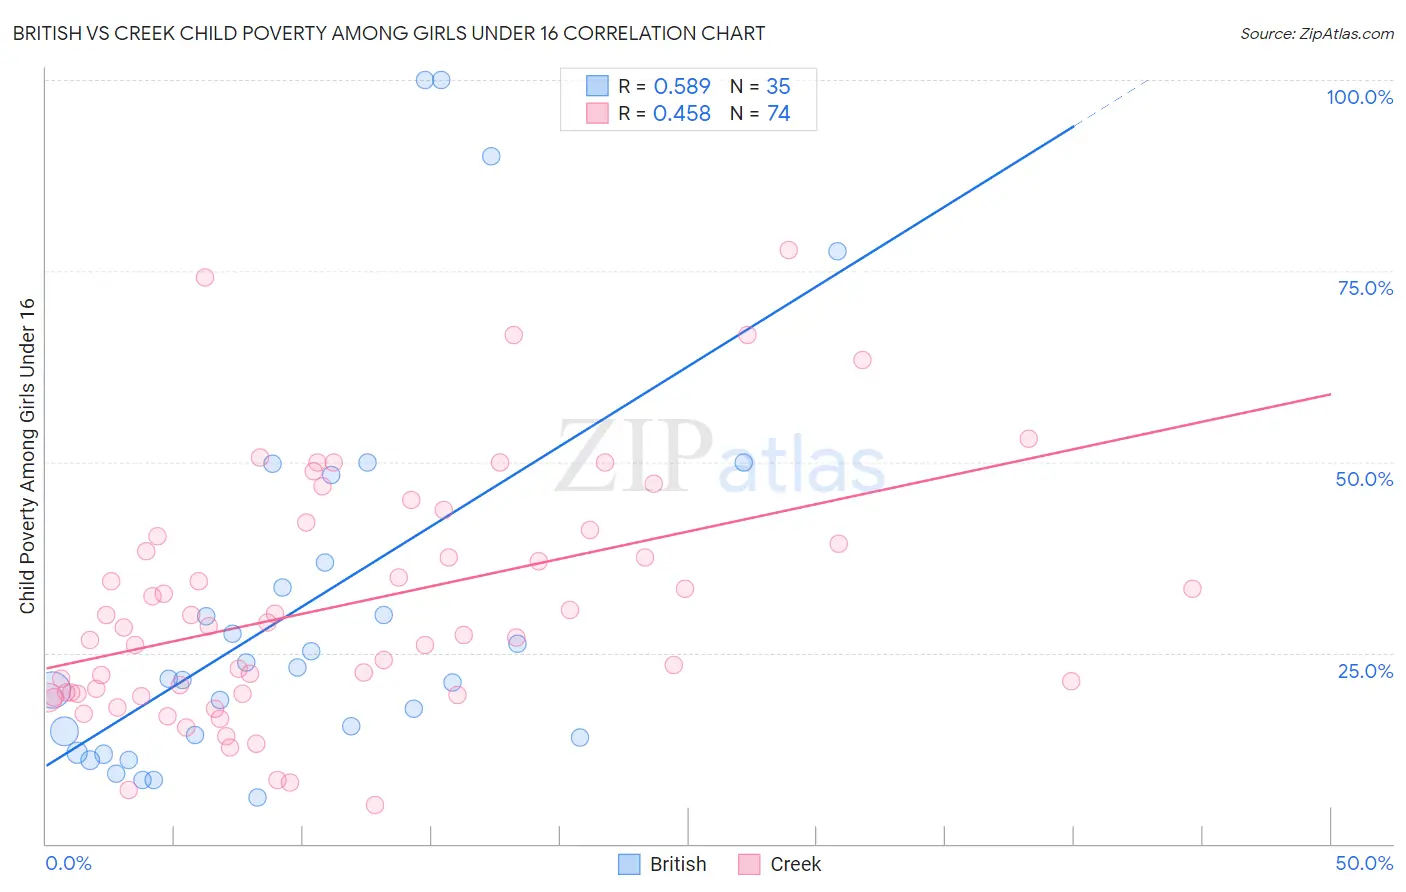
British vs Creek Child Poverty Among Girls Under 16 Correlation Chart
The statistical analysis conducted on geographies consisting of 514,706,514 people shows a substantial positive correlation between the proportion of British and poverty level among girls under the age of 16 in the United States with a correlation coefficient (R) of 0.589 and weighted average of 15.0%. Similarly, the statistical analysis conducted on geographies consisting of 177,262,374 people shows a moderate positive correlation between the proportion of Creek and poverty level among girls under the age of 16 in the United States with a correlation coefficient (R) of 0.458 and weighted average of 21.7%, a difference of 44.8%.
Child Poverty Among Girls Under 16 Correlation Summary
| Measurement | British | Creek |
| Minimum | 6.1% | 5.1% |
| Maximum | 100.0% | 77.8% |
| Range | 93.9% | 72.7% |
| Mean | 30.8% | 31.3% |
| Median | 21.5% | 28.4% |
| Interquartile 25% (IQ1) | 14.0% | 19.7% |
| Interquartile 75% (IQ3) | 36.8% | 40.3% |
| Interquartile Range (IQR) | 22.8% | 20.7% |
| Standard Deviation (Sample) | 25.6% | 15.8% |
| Standard Deviation (Population) | 25.2% | 15.7% |
Similar Demographics by Child Poverty Among Girls Under 16
Demographics Similar to British by Child Poverty Among Girls Under 16
In terms of child poverty among girls under 16, the demographic groups most similar to British are Immigrants from Malaysia (15.0%, a difference of 0.020%), Immigrants from South Africa (15.0%, a difference of 0.030%), Paraguayan (15.0%, a difference of 0.070%), Immigrants from Egypt (15.0%, a difference of 0.11%), and Romanian (15.0%, a difference of 0.16%).
| Demographics | Rating | Rank | Child Poverty Among Girls Under 16 |
| Immigrants | France | 96.2 /100 | #96 | Exceptional 14.9% |
| Immigrants | Latvia | 96.1 /100 | #97 | Exceptional 14.9% |
| Basques | 95.9 /100 | #98 | Exceptional 15.0% |
| Immigrants | Egypt | 95.7 /100 | #99 | Exceptional 15.0% |
| Paraguayans | 95.7 /100 | #100 | Exceptional 15.0% |
| Immigrants | South Africa | 95.6 /100 | #101 | Exceptional 15.0% |
| Immigrants | Malaysia | 95.6 /100 | #102 | Exceptional 15.0% |
| British | 95.6 /100 | #103 | Exceptional 15.0% |
| Romanians | 95.3 /100 | #104 | Exceptional 15.0% |
| Immigrants | England | 95.1 /100 | #105 | Exceptional 15.1% |
| Chileans | 95.1 /100 | #106 | Exceptional 15.1% |
| Immigrants | Ukraine | 95.0 /100 | #107 | Exceptional 15.1% |
| Immigrants | Brazil | 94.9 /100 | #108 | Exceptional 15.1% |
| Serbians | 94.8 /100 | #109 | Exceptional 15.1% |
| Immigrants | Croatia | 94.6 /100 | #110 | Exceptional 15.1% |
Demographics Similar to Creek by Child Poverty Among Girls Under 16
In terms of child poverty among girls under 16, the demographic groups most similar to Creek are Arapaho (21.7%, a difference of 0.010%), Ute (21.8%, a difference of 0.29%), Immigrants from Mexico (21.6%, a difference of 0.50%), Immigrants from Guatemala (21.9%, a difference of 0.56%), and Dutch West Indian (21.6%, a difference of 0.73%).
| Demographics | Rating | Rank | Child Poverty Among Girls Under 16 |
| Immigrants | Central America | 0.0 /100 | #306 | Tragic 21.4% |
| Immigrants | Bahamas | 0.0 /100 | #307 | Tragic 21.4% |
| Houma | 0.0 /100 | #308 | Tragic 21.5% |
| Bahamians | 0.0 /100 | #309 | Tragic 21.5% |
| Immigrants | Somalia | 0.0 /100 | #310 | Tragic 21.6% |
| Dutch West Indians | 0.0 /100 | #311 | Tragic 21.6% |
| Immigrants | Mexico | 0.0 /100 | #312 | Tragic 21.6% |
| Creek | 0.0 /100 | #313 | Tragic 21.7% |
| Arapaho | 0.0 /100 | #314 | Tragic 21.7% |
| Ute | 0.0 /100 | #315 | Tragic 21.8% |
| Immigrants | Guatemala | 0.0 /100 | #316 | Tragic 21.9% |
| Africans | 0.0 /100 | #317 | Tragic 21.9% |
| Immigrants | Dominica | 0.0 /100 | #318 | Tragic 22.1% |
| U.S. Virgin Islanders | 0.0 /100 | #319 | Tragic 22.1% |
| Hondurans | 0.0 /100 | #320 | Tragic 22.2% |