Black/African American vs Spanish Child Poverty Among Girls Under 16
COMPARE
Black/African American
Spanish
Child Poverty Among Girls Under 16
Child Poverty Among Girls Under 16 Comparison
Blacks/African Americans
Spanish
24.7%
CHILD POVERTY AMONG GIRLS UNDER 16
0.0/ 100
METRIC RATING
333rd/ 347
METRIC RANK
16.9%
CHILD POVERTY AMONG GIRLS UNDER 16
28.6/ 100
METRIC RATING
194th/ 347
METRIC RANK
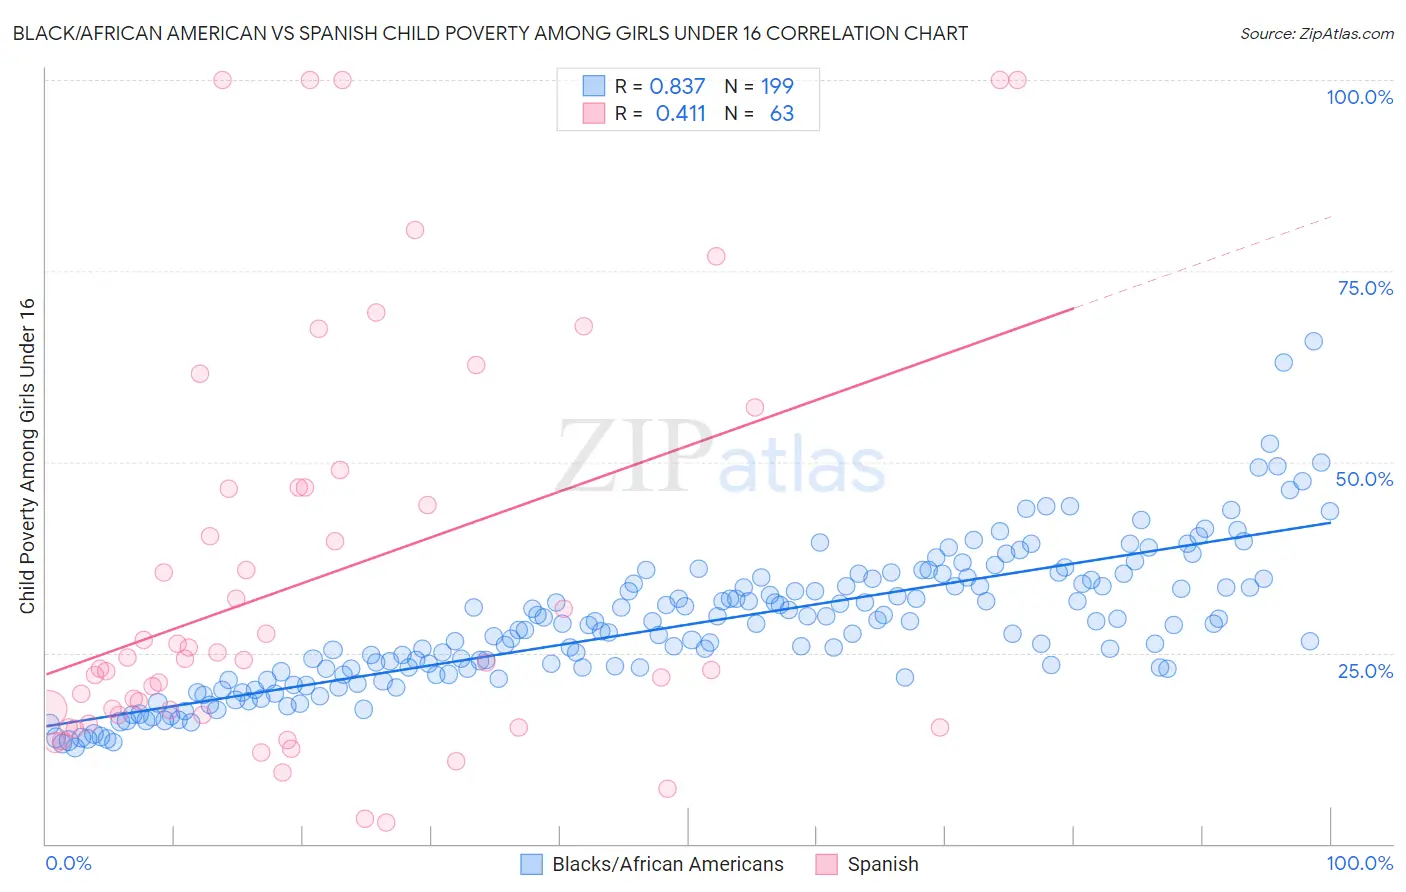
Black/African American vs Spanish Child Poverty Among Girls Under 16 Correlation Chart
The statistical analysis conducted on geographies consisting of 546,554,396 people shows a very strong positive correlation between the proportion of Blacks/African Americans and poverty level among girls under the age of 16 in the United States with a correlation coefficient (R) of 0.837 and weighted average of 24.7%. Similarly, the statistical analysis conducted on geographies consisting of 414,340,286 people shows a moderate positive correlation between the proportion of Spanish and poverty level among girls under the age of 16 in the United States with a correlation coefficient (R) of 0.411 and weighted average of 16.9%, a difference of 45.8%.
Child Poverty Among Girls Under 16 Correlation Summary
| Measurement | Black/African American | Spanish |
| Minimum | 12.6% | 2.9% |
| Maximum | 65.8% | 100.0% |
| Range | 53.1% | 97.1% |
| Mean | 28.6% | 34.8% |
| Median | 28.6% | 24.1% |
| Interquartile 25% (IQ1) | 22.1% | 16.8% |
| Interquartile 75% (IQ3) | 34.0% | 46.7% |
| Interquartile Range (IQR) | 11.9% | 29.9% |
| Standard Deviation (Sample) | 9.2% | 26.6% |
| Standard Deviation (Population) | 9.2% | 26.4% |
Similar Demographics by Child Poverty Among Girls Under 16
Demographics Similar to Blacks/African Americans by Child Poverty Among Girls Under 16
In terms of child poverty among girls under 16, the demographic groups most similar to Blacks/African Americans are Menominee (25.0%, a difference of 1.5%), Pueblo (25.2%, a difference of 2.2%), Native/Alaskan (24.0%, a difference of 2.5%), Apache (23.8%, a difference of 3.4%), and Immigrants from Dominican Republic (23.8%, a difference of 3.5%).
| Demographics | Rating | Rank | Child Poverty Among Girls Under 16 |
| Immigrants | Honduras | 0.0 /100 | #326 | Tragic 22.8% |
| Central American Indians | 0.0 /100 | #327 | Tragic 22.8% |
| Dominicans | 0.0 /100 | #328 | Tragic 23.7% |
| Kiowa | 0.0 /100 | #329 | Tragic 23.7% |
| Immigrants | Dominican Republic | 0.0 /100 | #330 | Tragic 23.8% |
| Apache | 0.0 /100 | #331 | Tragic 23.8% |
| Natives/Alaskans | 0.0 /100 | #332 | Tragic 24.0% |
| Blacks/African Americans | 0.0 /100 | #333 | Tragic 24.7% |
| Menominee | 0.0 /100 | #334 | Tragic 25.0% |
| Pueblo | 0.0 /100 | #335 | Tragic 25.2% |
| Sioux | 0.0 /100 | #336 | Tragic 25.6% |
| Yup'ik | 0.0 /100 | #337 | Tragic 25.8% |
| Cheyenne | 0.0 /100 | #338 | Tragic 26.3% |
| Crow | 0.0 /100 | #339 | Tragic 26.4% |
| Yuman | 0.0 /100 | #340 | Tragic 27.1% |
Demographics Similar to Spanish by Child Poverty Among Girls Under 16
In terms of child poverty among girls under 16, the demographic groups most similar to Spanish are Aleut (16.9%, a difference of 0.010%), Immigrants from Uganda (16.8%, a difference of 0.36%), Immigrants from the Azores (16.8%, a difference of 0.37%), Immigrants from Costa Rica (17.0%, a difference of 0.43%), and Celtic (17.0%, a difference of 0.48%).
| Demographics | Rating | Rank | Child Poverty Among Girls Under 16 |
| Immigrants | Morocco | 34.6 /100 | #187 | Fair 16.8% |
| Arabs | 34.5 /100 | #188 | Fair 16.8% |
| Immigrants | Bosnia and Herzegovina | 32.5 /100 | #189 | Fair 16.8% |
| Kenyans | 32.3 /100 | #190 | Fair 16.8% |
| Immigrants | Azores | 31.3 /100 | #191 | Fair 16.8% |
| Immigrants | Uganda | 31.3 /100 | #192 | Fair 16.8% |
| Aleuts | 28.7 /100 | #193 | Fair 16.9% |
| Spanish | 28.6 /100 | #194 | Fair 16.9% |
| Immigrants | Costa Rica | 25.6 /100 | #195 | Fair 17.0% |
| Celtics | 25.2 /100 | #196 | Fair 17.0% |
| Spaniards | 24.9 /100 | #197 | Fair 17.0% |
| Immigrants | Lebanon | 22.6 /100 | #198 | Fair 17.1% |
| Immigrants | Afghanistan | 22.4 /100 | #199 | Fair 17.1% |
| Immigrants | Uzbekistan | 21.5 /100 | #200 | Fair 17.1% |
| Immigrants | Kenya | 17.8 /100 | #201 | Poor 17.2% |